This report is an extension of a previous analysis study titled “RR-1014: High R Walls for the Pacific Northwest – A Hygrothermal Analysis of Various Exterior Wall Systems”, conducted by BSC for Walsh Construction, dated June 1, 2010 that examined the predicted thermal and hygrothermal performance of 17 different wall assemblies in Portland, Oregon.
Introduction
Many concerns, including the rising cost of energy, climate change concerns, and demands for increased comfort, have led to the desire for increased insulation levels in many new and existing buildings. Building codes are being modified to require higher levels of thermal control during almost every revision. The manner in which additional thermal insulation is added to framed wall assemblies is critical to their durability when considered over time.
This report is an extension of a previous analysis study titled "High R Walls for the Pacific Northwest – A Hygrothermal Analysis of Various Exterior Wall Systems", conducted by BSC for Walsh Construction, dated June 1, 2010 that examined the predicted thermal and hygrothermal performance of 17 different wall assemblies in Portland Oregon.1
As part of the initial study, four wall assemblies constructed using various thicknesses of exterior XPS insulation were analyzed. For this report, the results from the exterior XPS insulated walls were compared to similar assemblies constructed with the same R-value of rockwool insulation.2
This study was initiated following insulation deflection testing conducted by BSC with wood strapping installed over various thicknesses of rockwool insulation to determine the movement of the strapping under simulated cladding weights.3,4 This testing demonstrated that exterior claddings such as fiber-cement siding and wood siding can be installed on strapping over semirigid rockwool insulation5. The installation approach facilitates a continuous insulation application which substantially reduces thermal bridging impacts at exterior walls.
Objective
The objective of this study is to quantitatively compare the results from the June, 2010 study, Walls 3 to 6 with exterior XPS insulation, to similarly constructed walls using the same R-value of rockwool insulation.
Approach
Unlike the previous report, this analysis is limited to the hygrothermal analysis. It is divided into predicted winter time plywood sheathing wetting, and the drying of wetted plywood sheathing. The wall assemblies in this study were identical to the previous study except for the material properties of the exterior insulation used. Portland OR, in IECC climate Zone 4C was used for all of the hygrothermal analysis. The climate of Seattle, WA is similar to Portland, and the results of the analysis are largely applicable to wall systems in the Seattle area.
Analysis
Wall Assemblies Reviewed
The assembly reviewed in this report is shown below in Figure 2. Four variations of this assembly were analyzed;
- 1.25” (R5*) Rockwool exterior insulation
- 2.5” (R10*) Rockwool exterior insulation
- 5” (R20*) Rockwool exterior insulation
- 1.25” (R5*) Rockwool exterior insulation – with blown cellulose stud cavity insulation
* The thickness of rockwool was calculated for the specified R-values and then rounded up to the next ¼” thickness.
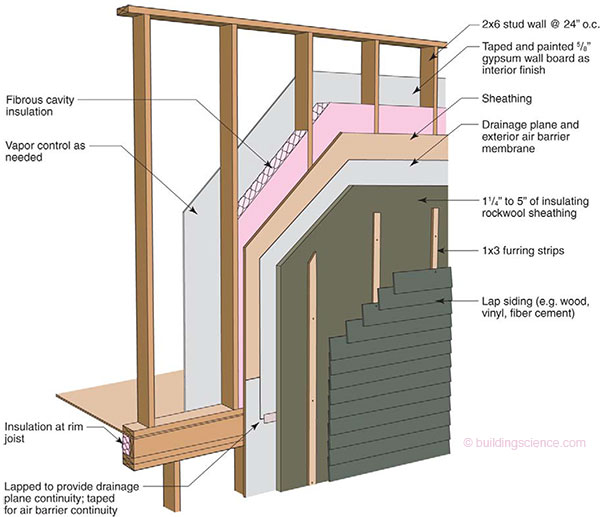
Figure 1: Typical application of semi-rigid rockwool insulation over wood framing
Hygrothermal Analysis
Hygrothermal analysis is the combined analysis of heat and moisture movement. For this research, WUFI® 4 from the Fraunhofer Institut Bauphysik was used to determine the hygrothermal performance of the chosen wall systems.
Fiber cement siding was chosen as the cladding system for the analysis at the request of Walsh Construction because it is one of the most common cladding materials used on multi-unit residential buildings in the Northwest. It should be noted that the use of different cladding materials could alter the results of the hygrothermal analysis for each wall system.
Also at the request of Walsh Construction Portland, Oregon was chosen as the climate to compare all of the wall systems. Portland is in DOE climate zone 4C, which experiences cold wintertime temperatures and has a humid marine climate. The climate of Seattle, Washington is similar to Portland, and the results of the analysis are largely applicable to wall systems in the Seattle area.
According to the 2010 Oregon Structural Specialty Code, a Class I or II vapor retarder is required on the interior of the framing in zones 5, and marine 4. A class III vapor retarder is permitted where any one of the conditions in Table 1405.3.1 (From Oregon Structural Specialty Code) is met. For Portland, in marine zone 4, class III vapor retarders are permitted for:
- Vented cladding over OSB, plywood, fiberboard or gypsum sheathings
- Insulated sheathing with R-value ≥ 2.5 over 2x4 wall
- Insulated sheathing with R-value ≥ 3.75 over 2x6 wall
All of the walls in this analysis are ventilated, so the vapor control required is a Class III (1.0 perm ≤ 10 perm). The vapor permeance requirement in Portland, OR according to the 2010 Oregon Structural Specialty Code is the same in the 2009 International Residential Code (IRC).
For this report, WUFI® was used to simulate two different scenarios which have been shown to cause performance problems for wall systems; wintertime condensation, and ability to dry following a wetting event.
The only sheathing condensation issue examined in this report was as a result of vapor diffusion. It is assumed that there is no air leakage from the interior resulting in condensation on the plywood sheathing. Air leakage condensation potential is dependent on the sheathing temperature, so the potential for condensation will be the same for the same R-value of exterior rockwool as exterior XPS. Air leakage condensation potential graphs can be found in the June 2010 report.6
The diffusion condensation potential was determined by analyzing the moisture content of the sheathing throughout the year. The diffusion condensation potential is different because the ability for water vapor to move through the rockwool insulation is different than the XPS. The interior relative humidity for these simulations was a sinusoidal condition varying from a minimum of 40% in the winter to a maximum of 60% in the summer. The interior relative humidity is strongly correlated to occupancy behavior and ventilation strategies. Typically, the indoor relative humidity in a Portland climate will decrease to between 30% and 40% in the winter months. In extremely cold climates this could decrease even further. If humidification is used, or there is inadequate ventilation in a relatively airtight enclosure, the RH could increase to 40 or 50% (or possibly even higher) which increases the risks significantly. Risks are increased because interior humidity will move through the enclosure, by either air leakage or vapor diffusion and many cases of moisture related durability issues of the sheathing have been observed in buildings with elevated relative humidities.
For hygrothermal simulation analysis, the simulations were conducted for five continuous years to ensure that the assembly was at equilibrium with both the interior and exterior conditions before they were compared. This ensures both equilibrium and allows inspection of the data to ensure long term accumulation does not occur under the simulated conditions.
Figure 2 shows the comparative plywood sheathing moisture content of two assemblies insulated with R5 exterior insulation. There is evidence of predicted inward vapor drives through the rockwool insulation in the summer months shown by the small peaks in the graph, but the assembly is also able to dry out very quickly. Neither assembly exceeds a very safe sheathing moisture content of 16% MC.
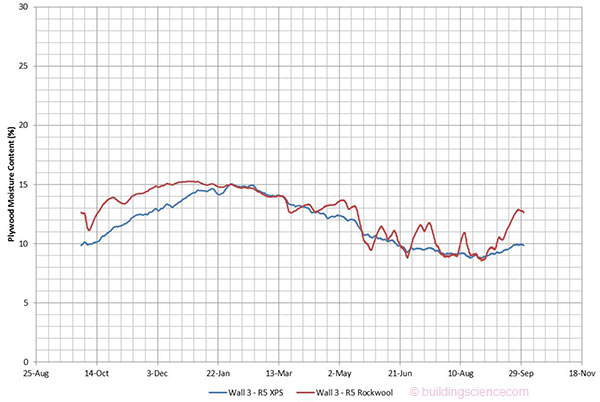
Figure 2: Comparison of plywood sheathing moisture content with R5 XPS and R5 rockwool
Figure 3, Figure 4, and Figure 5 also show very similar predicted plywood moisture contents between similar R-values of exterior XPS and rockwool insulation. There are no significant predicted hygrothermal performance differences, under these conditions, when comparing the predicted plywood sheathing moisture content caused by vapor diffusion into and out of the enclosure from both the interior and exterior.
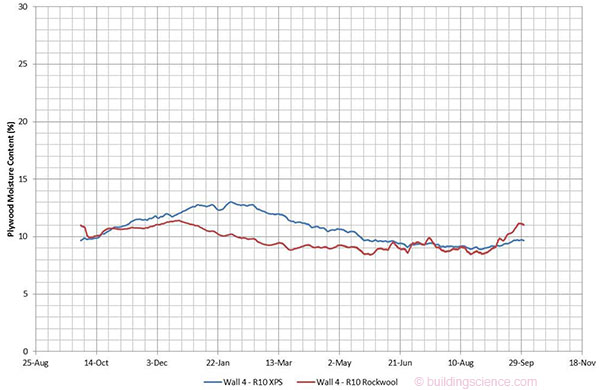
Figure 3: Comparison of plywood sheathing moisture content with R10 XPS and R10 rockwool
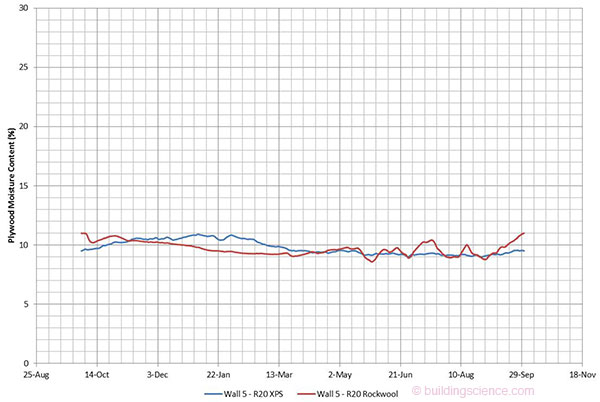
Figure 4: Comparison of plywood sheathing moisture content with R20 XPS and R20 rockwool
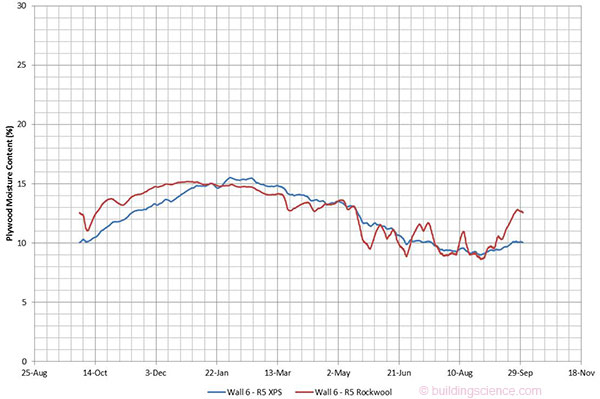
Figure 5: Comparison of plywood sheathing moisture content with R5 XPS and R5 Rockwool with cellulose cavity insulation
The second analysis conducted by using WUFI® 4 hygrothermal modeling is the drying ability of the different wall systems. Drying was quantified by beginning the simulation with elevated sheathing moisture content of 250 kg/m3 (approximately 50%) in the wall systems and observing the drying curve of the wetted layer. Drying is a very important aspect of durability since there are many sources of possible wetting including rain leakage, air leakage condensation, vapor diffusion condensation and construction moisture. If a wall is able to dry adequately, it can experience some wetting without any long-term durability risks.
The drying analysis is more of a comparison of relative drying potential since it’s difficult to predict when and how much a wall will be wetted.
Good enclosure water management design details will minimize the risk of wetting, but drying potential should not be forgotten during enclosure design.
Only one analysis wall is shown here as the results are similar for all four comparison walls, and the other analysis graphs are included in the appendix. Figure 6 shows the drying of the wall assemblies with R10 XPS and R10 rockwool, both in June, and January. There is no polyethylene vapor barrier in any of these wall assemblies. The simulations were conducted with latex paint on the interior surface which is the equivalent to a Class III vapor control layer so drying can occur to both the interior and exterior of the sheathing.
In both January and June, the XPS wall dries more slowly than the comparison wall with rockwool insulation. This is because there is a strong vapor drive potential to the exterior because of the warmer sheathing temperatures, even when the relative humidity of the exterior is quite high in colder weather and rockwool allows vapor diffusion drying to the exterior. The drying results following one month (30 days) is summarized . . .
Download complete report here.
Footnotes:
- www.walshconstructionco.com and www.buildingscience.com, High R Walls for the Pacific Northwest – A Hygrothermal Analysis of Various Exterior Wall Systems. 2010
- Rockwool insulation is also referred to as mineral wool insulation
- http://www.greenbuildingadvisor.com/blogs/dept/musings/installing-mineral-wool-insulation-overexterior-wall-sheathing
- http://www.roxul.com/residential/products/roxul+comfortboard+is
- The rockwool insulation used in this study was Roxul Comfortboard IS and has a density of 8lb/ft3
- www.walshconstructionco.com and www.buildingscience.com, High R Walls for the Pacific Northwest – A Hygrothermal Analysis of Various Exterior Wall Systems. 2010