Side-by-side energy testing and monitoring was conducted on two houses in Louisville, KY. Both houses were identical except that one house was constructed with conventional U.S. 2x4 studs and a truss roof while the other house was constructed with stress-skin insulated-core panels for the walls and second floor ceiling. A discrepancy is noted between energy savings predicted by measurement and simulation which may be related to rated performance versus field performance of insulation systems. From the data, it appears that this type of industrialized construction has energy efficiency advantages over conventional construction.
Introduction
Background
Stressed-skin insulated-core (SSIC) panels are gaining favor in the residential construction industry as an alternative to conventional stud-frame construction. SSIC panels most generally consist of two layers of oriented strand board (OSB) as structural skins separated by foam insulation. The panels are manufactured, and sometimes machined for openings and angle cuts, in a factory, increasing the potential for cost savings through industrialization. Various splining and connection methods are used on-site to assemble the panels into a building envelope. A distinct energy advantage of the panel construction is that the insulation is less interrupted by framing and air movement within the insulation is not possible.
Stressed-skin insulated-core (SSIC) panels are gaining favor in the residential construction industry as an alternative to conventional stud-frame construction. SSIC panels most generally consist of two layers of oriented strand board (OSB) as structural skins separated by foam insulation. The panels are manufactured, and sometimes machined for openings and angle cuts, in a factory, increasing the potential for cost savings through industrialization. Various splining and connection methods are used on-site to assemble the panels into a building envelope. A distinct energy advantage of the panel construction is that the insulation is less interrupted by framing and air movement within the insulation is not possible.
Scope
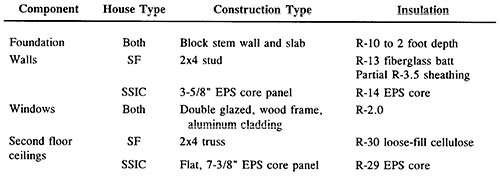
A side-by-side evaluation was conducted to assess the heating energy-use benefits of using SSIC panels in residential construction in Louisville, Kentucky, U.S.A. (Rudd 1994) (Note: This paper includes additional information resulting primarily from analysis of hourly simulations). One house was constructed as a conventional U.S. 2x4 stud-frame, and the other was constructed with SSIC panels. The SSIC wall panels were 4 feet wide by 8 feet high and 2x4 lumber was used for the vertical spline. The SSIC ceiling panels were 4 feet wide by 16 feet long and 2x8 lumber was used for the spline. Since the solid lumber splines extended between the interior OSB skin to the exterior OSB skin, they created more of a thermal short than other splining methods used with the SSIC technology. Both houses were privately
financed and constructed by the same builder who has experience with both types of construction. The builder was not coached to build either house differently, better or worse, than he normally would. Each two-story house has 1200 ft2 floor area and has the same floor plan, elevations, orientation, and nearly the same exterior colors. Both houses are heated by natural gas furnace. All the air distribution ducts are within the thermal envelope of the building. A comparison of the basic building parameters for the two houses is given in Table 1. Energy testing and unoccupied monitoring with simulated occupancy was conducted. Hourly simulations were run to compare to measured energy-use data and to make seasonal energy-use predictions.
Table 1: Thermal Envelope Parameters of the Stud-Frame (SF) and the Stressed-Skin Insulated-Core (SSIC) Panel Houses
Methodology
Both houses were designed to have a conductive thermal transmittance (UA) equal to each other. Calculations, using the as-built configuration and thermal transmission data from a reference handbook (ASHRAE 1989), showed that the SSIC panel house conductive UA was 265 Btu/hr-°F and the frame house conductive UA was 271 Btu/hr-°F, a difference of only 2%. Figures 1a and 1b show the conduction heating load distribution for the stud-frame house and the SSIC panel house, respectively. When the measured infiltration UA was included, from the average of all air tightness testing results shown in Figure 2, the total building UA for the panel house was 5% lower than that of the frame house. Air infiltration made up 15% and 12% of the total heating load for the frame and panel houses, respectively.
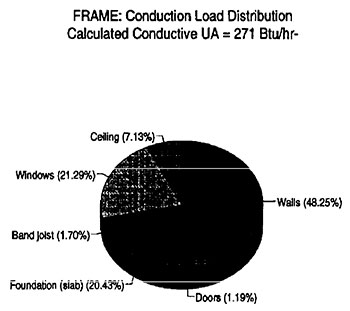
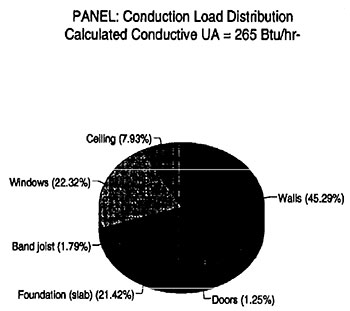
Figure 1a (above left): Conduction Heating Load Distribution and Calculated Conductive UA for the Stud-Frame House; Figure 1b (above right): Conduction Heating Load Distribution and Calculated Conductive UA for the SSIC Panel House
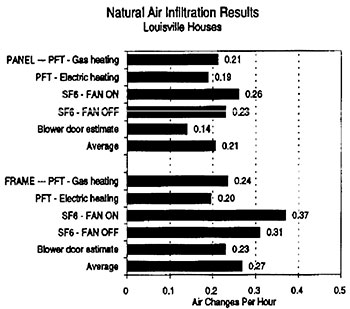
Figure 2: Natural Air Infiltration Results—Blower Door Estimate and Tracer Gas
Five days of building diagnostics testing was performed on each house. The testing assessed thermal insulation quality by infrared imaging, building envelope and air distribution system air-tightness by fan pressurization and tracer gas, pressure effects inside the house due to interactions of the air distribution system, calculated versus measured building load coefficients by co-heating, and building thermal decay by cool-down.
Four weeks of short-term energy-use monitoring was conducted, including two weeks of electric heating energy-use monitoring and two weeks of gas heating energy-use monitoring. The houses were unoccupied during monitoring. In addition to measurement of heating energy-use, measurements of house dry bulb temperature, mean radiant temperature, south wall surface temperature, and relative humidity were continuously monitored. Passive perfluorocarbon tracer gas sources and samplers were deployed to measure the time-averaged house air exchange rates (Dietz 1986). A weather measurement station was installed on top of the SSIC house and continuously monitored dry-bulb temperature, relative humidity, global horizontal and global south-facing vertical solar radiation, wind speed and wind direction.
Two regression models were employed to fit the daily heating energy-use data. The first model included only two coefficients:
y = a1 * (Tin - Tout) + a2 (1)
where:
Y = heating energy-use
T in = inside temperature
T out = outside temperature
a1, a2 = regression coefficients
The second model included a third coefficient to pick up the impact of solar gain:
y = a0 * Ihor + a1 * (Tin - Tout) + a2 (2)
where:
Ihor = horizontal solar irradiance
The regression models were used to make a prediction of seasonal energy-use by applying TMY weather data to the models.
In addition, the DOE2.lE hourly building energy simulation program was employed to predict seasonal heating energy-use. The initial intent was to “calibrate” the simulation model by inputing measured on-site weather data and comparing the simulation energy-use output to the measured energy-use. If agreement was poor, the model would be evaluated to find the possible causes and make adjustments as reasonable (Lutz 1992). Editing the solar radiation part of the weather file for input to the simulation proved to be problematic and was not accomplished. More work is on-going in this area. Heating energy-use predictions by the DOE2 simulation are given here for three cases: 1) Seasonal (November thru March) heating energy-use with original TMY weather file, and the average measured air change rate for both houses; 2) seasonal heating energy-use with original TMY weather file, and 0.35 ACH air change rate for both houses; and 3) partial season (actual monitoring periods) energy-use using a TMY weather file with fields edited for measured air temperature, dewpoint, wind speed and wind direction, with the average measured air change rate for both houses.
Results
Energy Testing/Building Diagnostics
Infrared scanning indicated that the thermal insulation quality of both houses was good. Few defects were found which would have a significant impact on energy use. The stud-frame house had two insulation defects that are worth noting. One defect involved a ceiling area over the stairwell, approximately 6 ft2, where the blown-in insulation was missing. The other defect became apparent only after infiltration was forced by the blower door—an air leak occurred where the exhaust duct in the first floor bathroom penetrated the band joist and was not completely sealed. Examination of a photograph of that same penetration, taken during construction, revealed that a worker had attempted to seal the gap, but he did not get it sealed well enough. These defects were not fixed.
Air-tightness was evaluated for the building envelopes and the air distribution systems. Blower door and tracer gas tests showed that, on average, the envelope of the SSIC panel house was 22% more air-tight. The tracer gas tests, using SF6 and a specific vapor analyzer, showed that both houses had an increase in air infiltration when the air distribution system was operating. However, duct leakage to the outdoors was less than the blower door could measure accurately. Figure 2 gives a summary of these results. Also included in Figure 2 are results from the perfluorocarbon tracer (PFT) time-averaged infiltration measurements taken during the electric and gas heating monitoring periods. The averaging period was 17 days for electric heating and 21 days for gas heating. PFT results showed higher infiltration for the frame house compared to the panel house and higher infiltration for the gas heating monitoring period compared to the electric heating monitoring period. During the gas heating period, the influence of the natural draft furnace, and the movement of air by the air distribution system, may have contributed to higher infiltration. Also, the average outdoor temperature during the gas heating period was about 6.50 F lower which may have driven more stack-effect infiltration. The wind speed was similar for both periods. Because of the variation in natural air infiltration, as measured by the three methods, the results are somewhat inconclusive in an absolute sense; however, they are consistent in a relative sense in that the panel house was always tighter and air infiltration was always greater when the furnace fan was operating. Both houses were considered to be more airtight than average houses in the Louisville area, an average of all the air-tightness test results yielded a natural infiltration rate of 0.27 for the frame house and 0.21 for the SSIC panel house. The American Society of Heating Refrigerating and Air-Conditioning Engineers (ASHRAE) Standard 62-1989 recommends that houses should have at least 0.35 air changes per hour or 15 ft3/min of ventilation air per occupant. Based on that, a whole-house fresh air ventilation system should be considered for both the frame and panel houses. For the Louisville climate, an exhaust-only ventilation system providing at least 0.35 air changes per hour, or about 60 ft3/min for these particular houses, may be the most cost-effective. This may be accomplished by installing a two-speed exhaust fan in the attic which is ducted to each bathroom and to the outdoors. The fan could run on low speed constantly, and be manually switched to high speed by occupants. A humidistat control could also be linked to the high speed mode. A 100 ft3/min, 48 W fan would use about 420 kW-hr per year to operate continuously. At $0.08/kW-hr the cost would be $34/yr. DOE2.lE simulation results, listed in Table 4, show that raising the air change rate to 0.35 ACH would increase heating energy-use by 345 kW-hr for the frame house and 599 kW-hr for the panel house. Some have questioned why it is recommended to seal a house tightly and then install a fan to ventilate it. The answer is that relying on random leaks in the building, and unknown pressure forces due to wind and temperature, does not assure adequate ventilation at all times, and it may lead to overventilation and higher energy bills. In addition, leaky building envelope and air distribution systems can cause pressure imbalances which may lead to moisture accumulation problems or even the malfunction of combustion appliances.
A series of measurements were taken to evaluate pressure differentials within the building and between the building interior and the outdoors. The impact of building pressure differentials can affect occupant health and safety, building durability, and energy-use. Since both houses have gas furnaces inside the conditioned space, occupant health and safety could be affected if negative pressures caused the furnace to back-draft. Differential pressure measurements taken between the utility closet and the outdoors showed pressures between -2.0 Pa and -5.7 Pa. These measurements were taken with the furnace fan on, and the kitchen and bath exhaust fans on. A clothes dryer, which will be installed inside the house, would have increased the exhaust flow. Since the utility closet has two 6” ducts connecting it to the ventilated attic to provide combustion air and dilution air, the utility closet doors should be weather stripped to better seal the furnace and gas hot water heater from the main body of the house, or use sealed combustion appliances. Additional pressure differential measurements taken between closed rooms and the main body of the house, with the furnace fan and exhaust fans on, showed that the main body depressurized to about -5 Pa while the closed rooms pressurized to between 3 and 10 Pa. These pressure differentials would cause increased infiltration in the main body and increased exfiltration in the closed rooms, resulting in increased energy-use (Cummings 1992). In a cold climate, if warm moist air is forced through the building shell due to pressurized rooms, moisture may condense inside the building shell and cause material degradation. Adequate return air flow from closed rooms could be provided by separate return ducts, or transfer ducts which simply connect closed rooms to the main body with a short duct.
A co-heating test was performed to determine the as-built total UA (building load coefficient, including infiltration). This test monitored the inside-to-outside temperature difference and the electric heating energy used to hold the . . .
Download complete document here.