Temperature and humidity meters are useful tools for building investigations, specifically to measure HVAC equipment performance.
Introduction
I’m back, with more tools of the trade that I use for forensic examinations and to diagnose problems in buildings. I’m roughly breaking this series of articles into the topics of air, heat, and moisture: this time, we’re looking at temperature and humidity meters, how I use them for investigations and—more specifically—to take HVAC (heating/ventilation/air conditioning) measurements.
Temperature and Humidity Meters
In the previous “Air” segment, I mentioned meters like the Kestrel, which in addition to air velocity, also measure temperature (T) and relative humidity (RH). However, if I’m specifically looking at measuring T and RH, I rely on meters like those below—there is a wide range in terms of cost, accuracy, and usability/features. This is not meant as an exhaustive list—just an introduction to those that I have worked with for different reasons:
- Extech Temperature/Humidity Pen ~$35 (Figure 1): It’s completely basic, but it’s always in my kit, so I don’t have to worry about forgetting it back at the shop. RH accuracy isn’t that great.
- Fieldpiece Dual In-Duct Psychrometer ~$250 (Figure 2): This is my day-to-day, go-to meter. it displays T, RH, wet bulb, dewpoint, Btu/lb—all the geeky measurements you need (or don’t need). It also has two probes, which makes it very useful for HVAC measurements—more on that later.
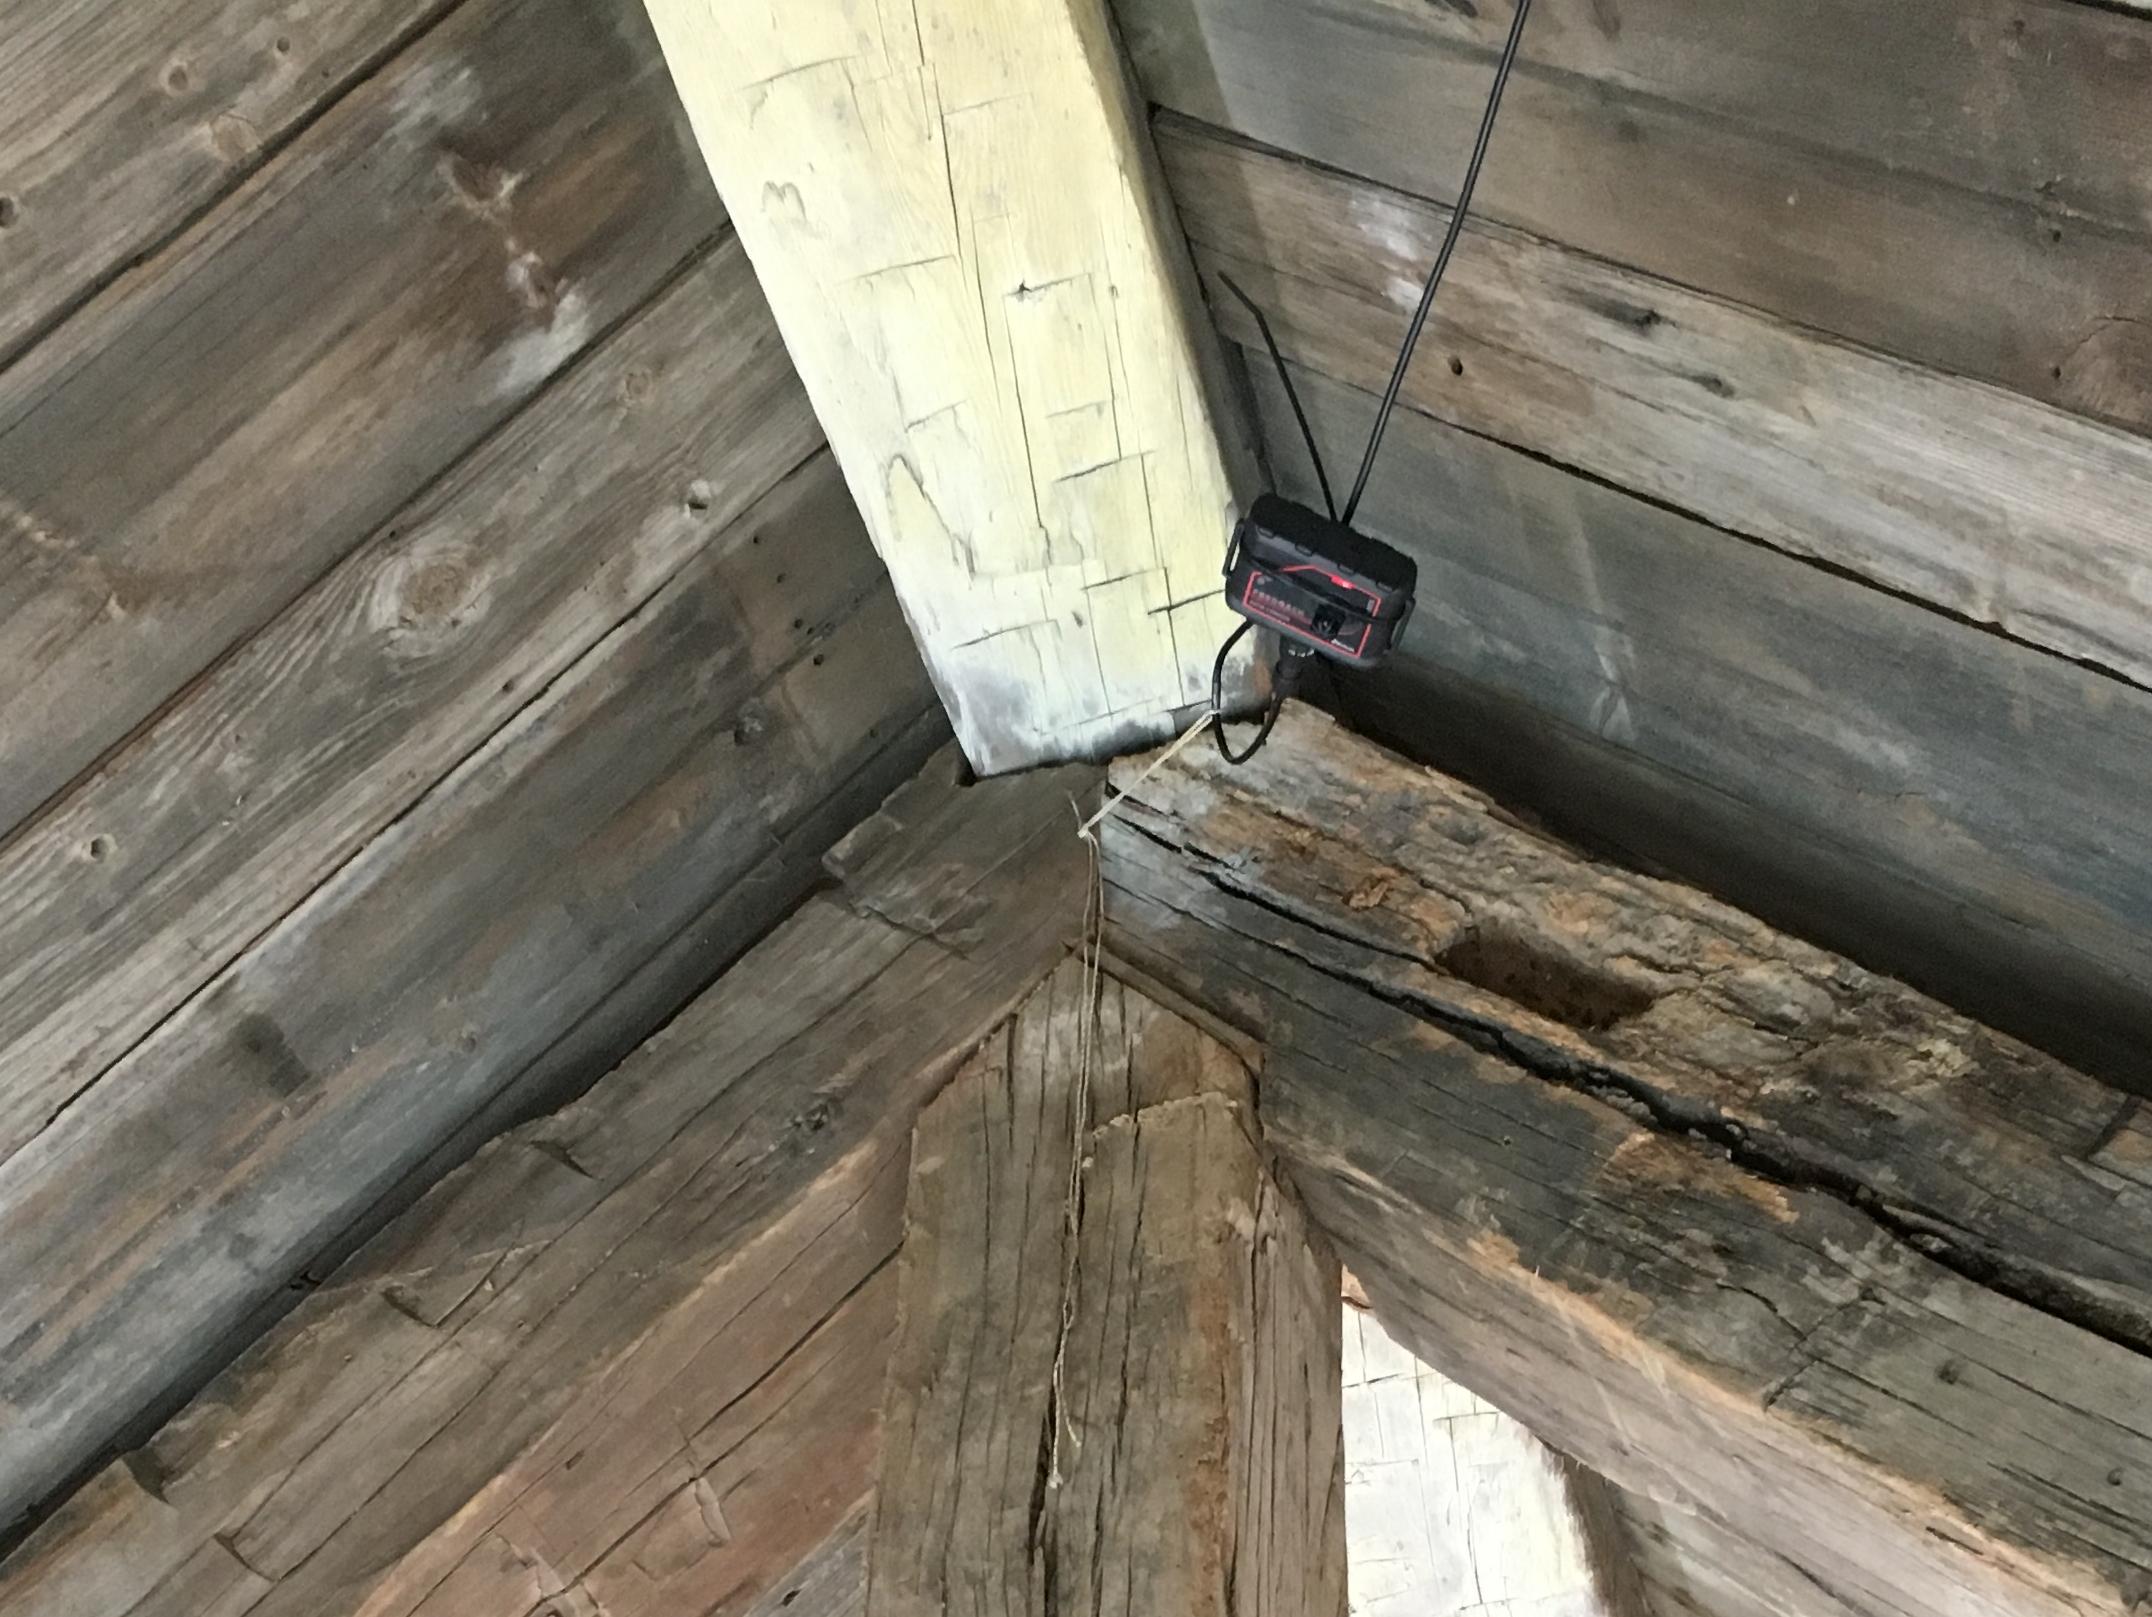
- Tramex DL-RHTX ~$300 (Figure 3): I read this instrument by connecting via Bluetooth to my phone. It has both an on-board probe and a remote (wired) probe. Even more importantly, I can set it up to data log over time—Figure 4 shows some quick monitoring of an unvented roof assembly, comparing interior conditions to rafter bay conditions.
- Vaisala HMI41 and HMP42 ~$1000+ (not shown): This is a fancy research-grade T/RH meter. I seldom use it, given that I don’t want to drop a $1000 meter from an attic hatch, but I’ll talk about its ideal application later.

Figure 1: Temperature/humidity pen
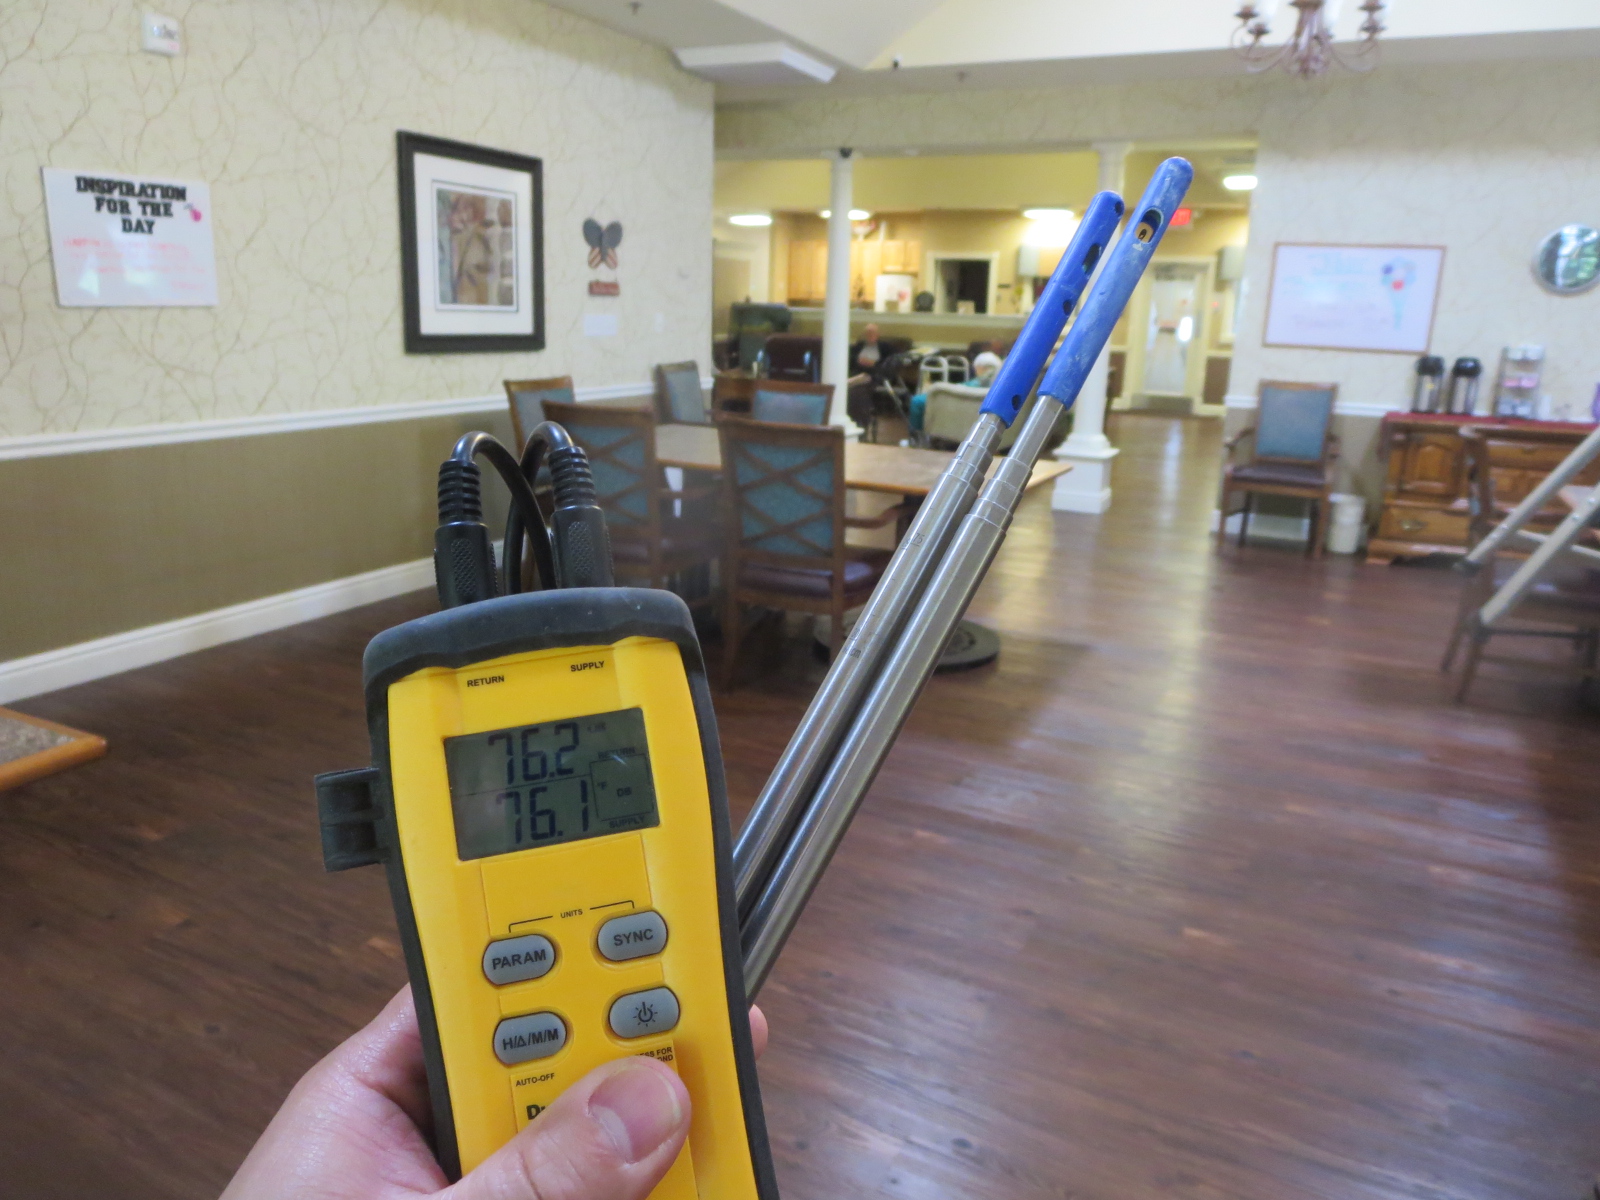
Figure 2: Dual in-duct psychrometer
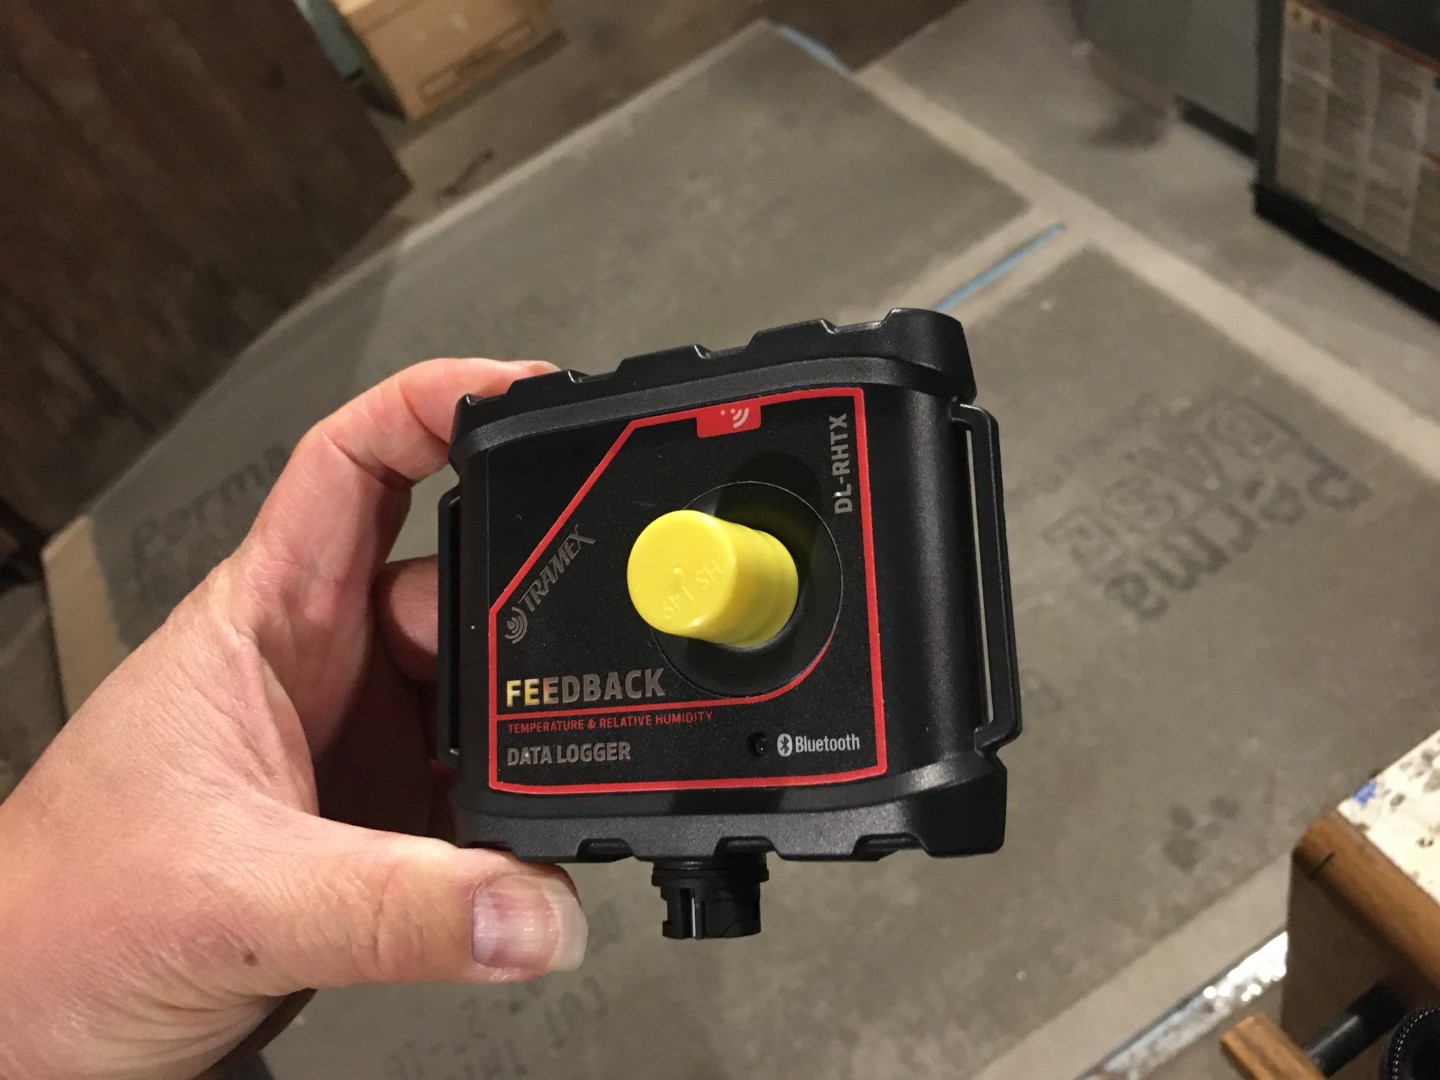
Figure 3: Tramex DL-RHTX T/RH meter
One word of warning is that RH sensors often drift over time—and to begin with, the sensors themselves are often ±3%. At a minimum, think about comparing calibration with other meters, if available. The “real” way to calibrate RH sensors is with saturated salt solutions, but that’s more than I’ve done myself (at least since grad school).
In any case, if you see people reporting “33.2% RH,” you should realize that the meters they’re using are probably nowhere near that level of accuracy—you can omit one decimal place, or possibly two with some of the worst meters.
Thinking in Dewpoint
I don’t want to go down the rabbit hole of providing a psychrometrics 101 lesson--Martin has provided an introduction here. One takeaway is that relative humidity doesn’t tell you much about the moisture level of the air, unless you also know the temperature. For instance, 90% RH air can be drier (hold less absolute moisture) than 50% RH air, if we’re talking about cold outside air and warm indoor air, respectively.
It is often very useful to know the absolute air moisture content—it lets you compare the moisture levels in air of two different temperatures. This would let you know, for instance, whether opening a window in summer will increase or decrease interior moisture levels, or whether outdoor air is a source of the humidity problems occurring inside.
The common metrics for “absolute air moisture content” include:
- “Grains”(i.e. grains of moisture per pound of dry air) or pounds of moisture per pound of dry air (a.k.a. the “humidity ratio”) is a direct measurement of the mass of moisture in the air. These are the go-to metrics for HVAC dehumidification processes, but not nearly as useful for forensic investigations.
- Vapor pressure is the partial pressure of water vapor in a mixture of gases like air (typically reported in Pa, kPa, psi or inches Hg). When we talk about moisture moving from “more to less,” vapor pressure is often a good metric to visualize things—that pressure difference can move moisture from one side to another. My boss, Joe Lstiburek, uses it to talk about ice formation and foam shedding due to moisture “pushing” through spray foam on the space shuttle’s external tank. Vapor pressures are also very useful if you want to show off what a building geek you are, and confuse everyone else.
- The dew point temperature is the temperature at which moisture in the air begins to condense on hard surfaces. I personally “think in dewpoint,” and try to convince others to do the same. The big advantage is that I have another useful data point besides “more versus less moisture”—it also tells me how cold a surface needs to be for condensation problems (and therefore moisture problems) to start.
“Thinking in dewpoint” is also useful for roughly gauging summertime comfort inside and outside—it’s reported in the weather forecasts nowadays, and it lets you know whether things will be miserable and muggy despite temperatures looking cool:
- 50°F dewpoint:This is equivalent to 75°F/41% RH (or 70°F/49% RH)—beautiful California comfort conditions, or other Mediterranean climates. In California, this is what you get for living downwind of a giant dehumidifier called the Pacific Ocean.
- 60°F dewpoint:This is the edge of where things start to feel uncomfortable and muggy to me. The ASHRAE comfort standard (Standard 55, “Thermal Environmental Conditions for HumanOccupancy”) agrees with me, with a 62°F dewpoint recommended upper limit.
- 70°F dewpoint:Definitely unpleasant and muggy. For reference, Tampa, FL stays pretty much in the 70-80°F dewpoint range all summer long.
- 80°F dewpoint:Seriously unpleasant, but thankfully not all that commonplace for extended periods. Think of conditions on the island of Guam in a bad year, marinating in a warm bathtub of the South Pacific.
You might point out, “sure, dewpoint is great, but my meter only shows me temperature and RH” (the Fieldpiece meter above gives you dewpoint on the display). My old standby is to use online psychrometric calculators, like the one from The Sugar Engineers, as long as you have a network connection. But nowadays, I just punch the numbers into an app on my phone. The app can calculate all of the information for a single-point condition (Figure 5), or a “psychrometric process” (Figure 6)—i.e., how much cooling and dehumidification do I need in order to treat this air?
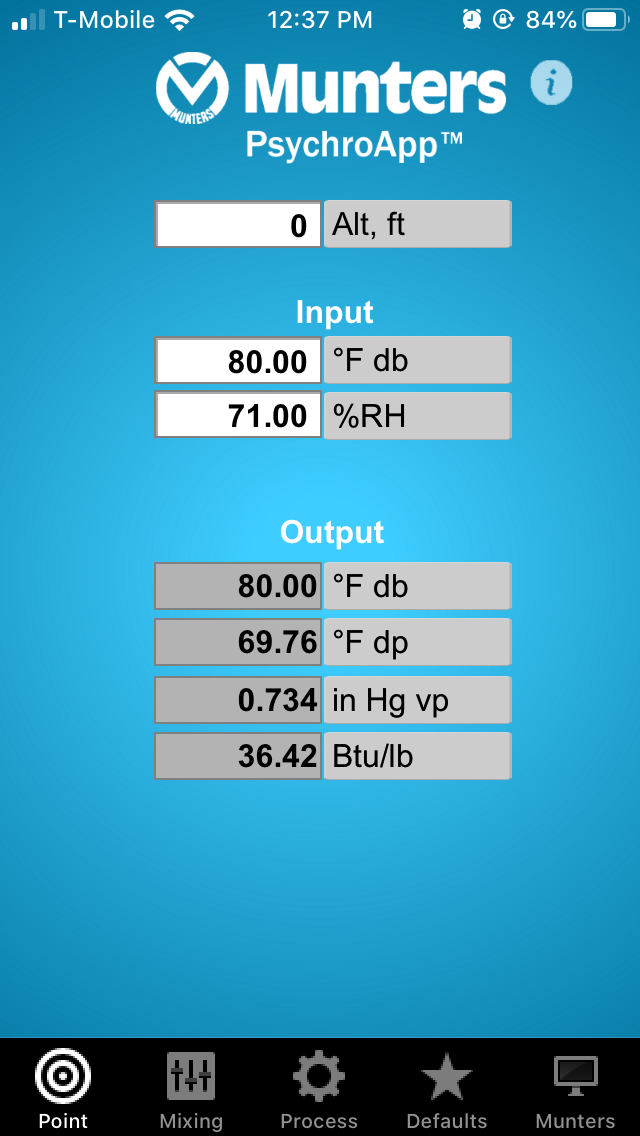
Figure 5: Munters PsychroApp single-point calculation
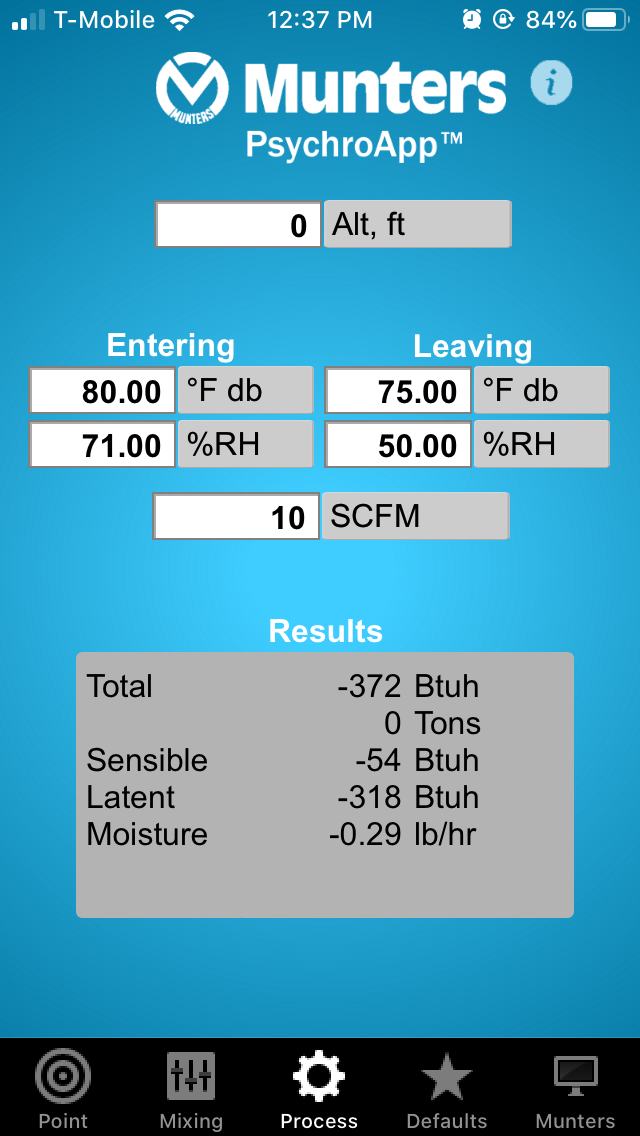
Figure 6: Munters PsychroApp process calculation (sensible cooling & dehumidification load)
Measuring Unvented Attic Stratification
One example of using T/RH measurements is studying temperature and moisture stratification in unvented attics. This has proven to be an issue with assemblies with insulation at the roof deck (also see Cool Hand Luke Meets Attics).
In open-cell spray foam attics, the roof sheathing is adsorbing (gaining) moisture, that is then getting blasted back out (into the attic) on a daily basis by the sun; this moisture then gets concentrated up at the roof ridge. This results in a gradient or increasing trend of moisture up towards the ridge, inside the attic.
We studied a test installation of a netted fiberglass unvented attic in Florida (Figure 7) and unfortunately, we found mold growing on the underside of the netting, but only at the top, 2-3 feet away from the ridge (Figure 8). In addition, if you lifted up the netting, the king post of the truss had mold inside the insulation cavity (Figure 9).
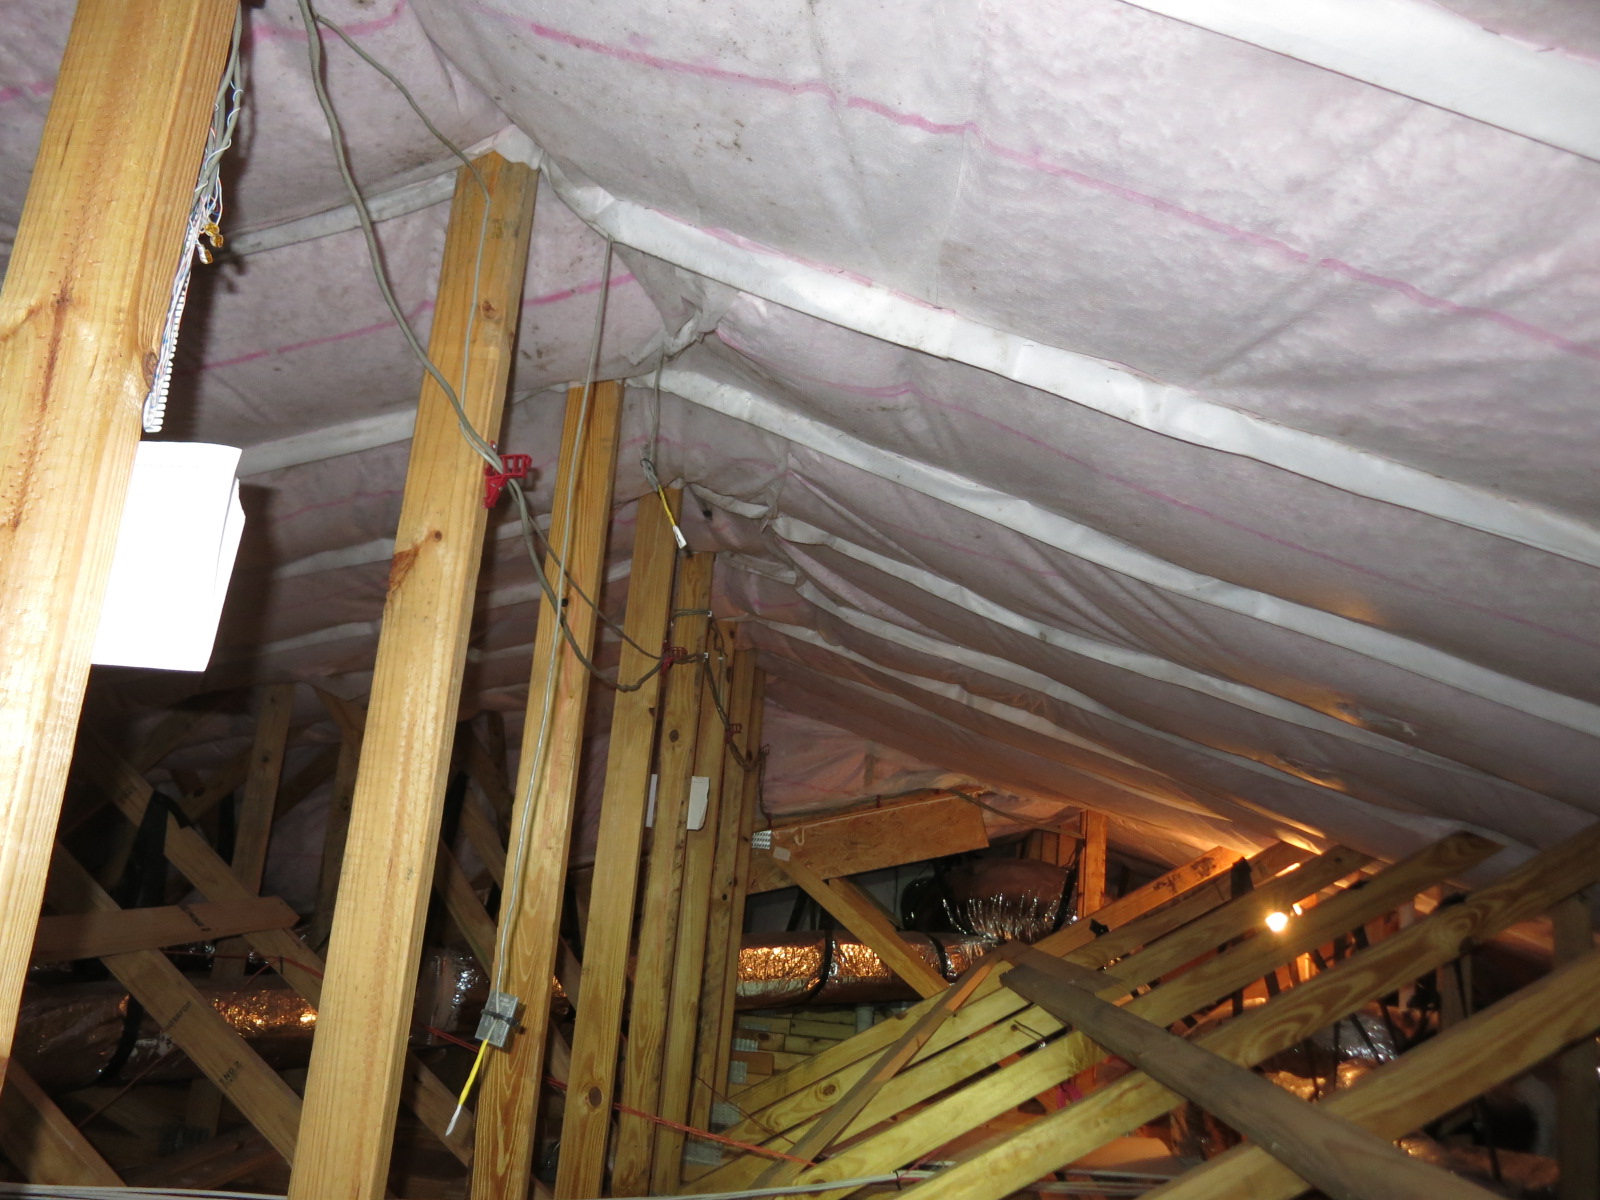
Figure 7: Unvented attic (netted fiberglass)
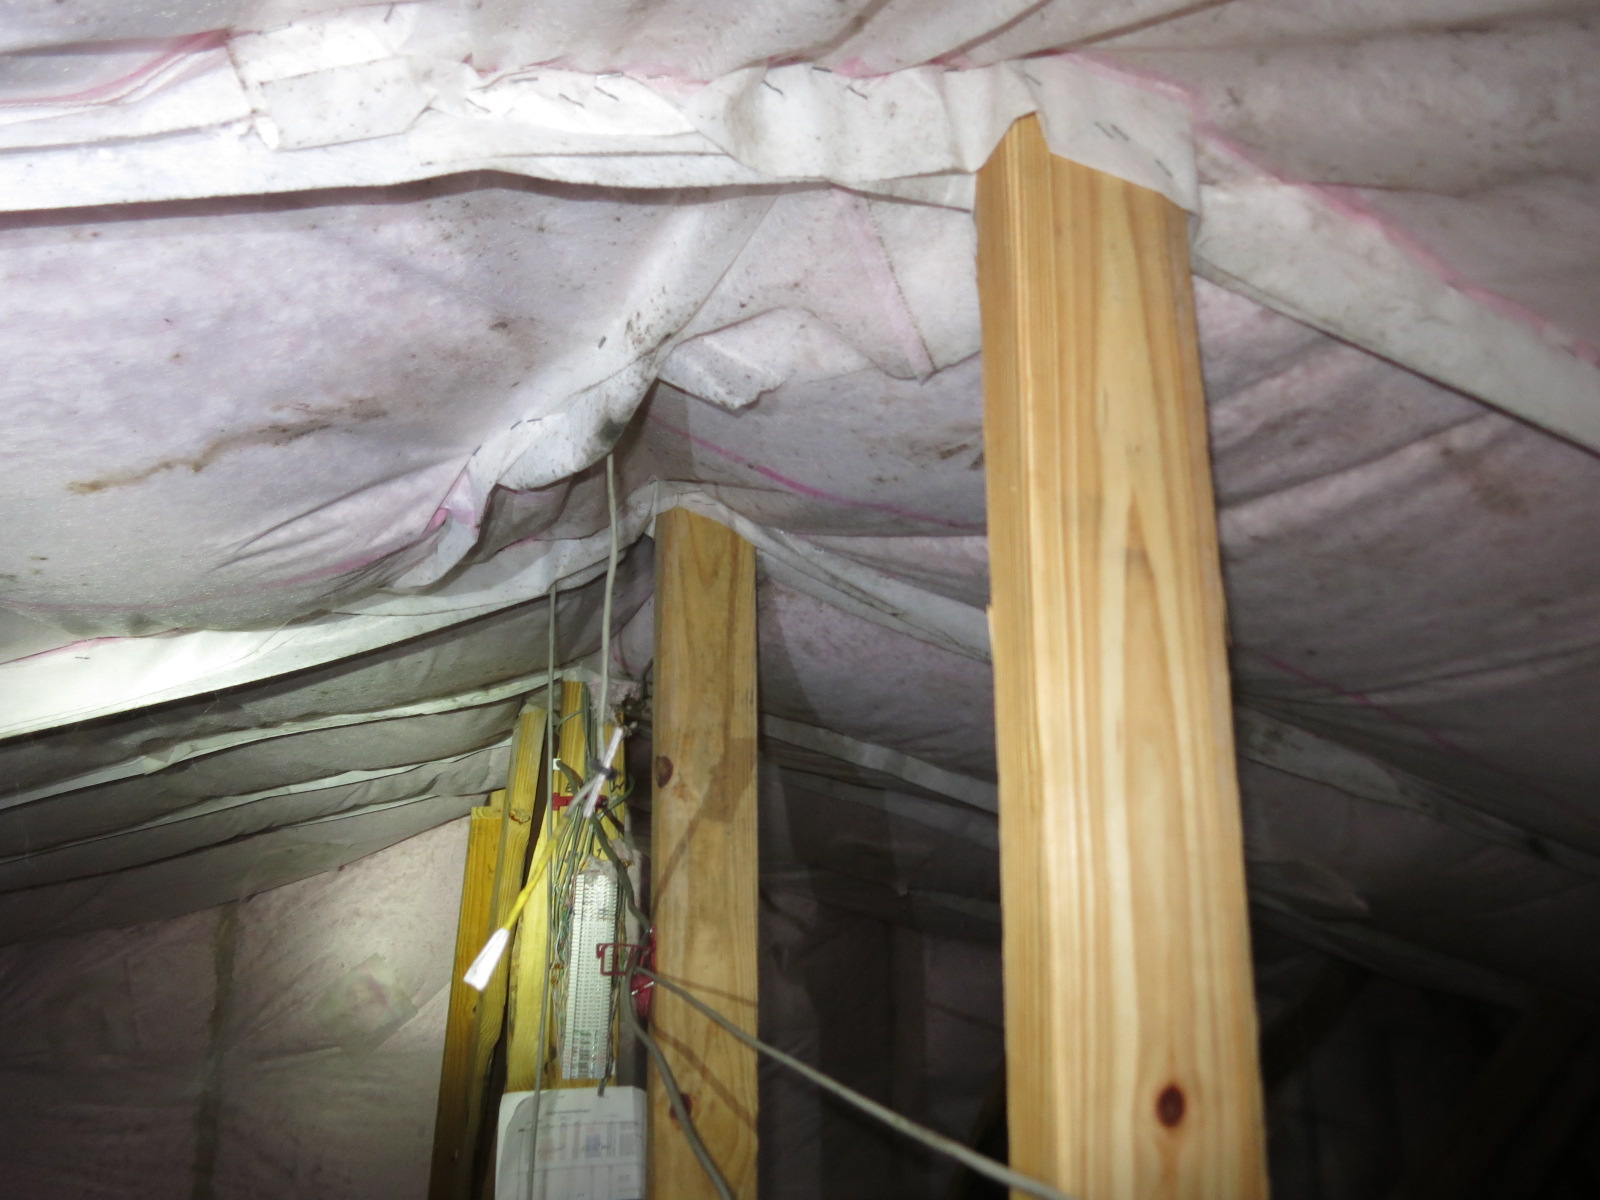
Figure 8: Mold spotting on netting near ridge
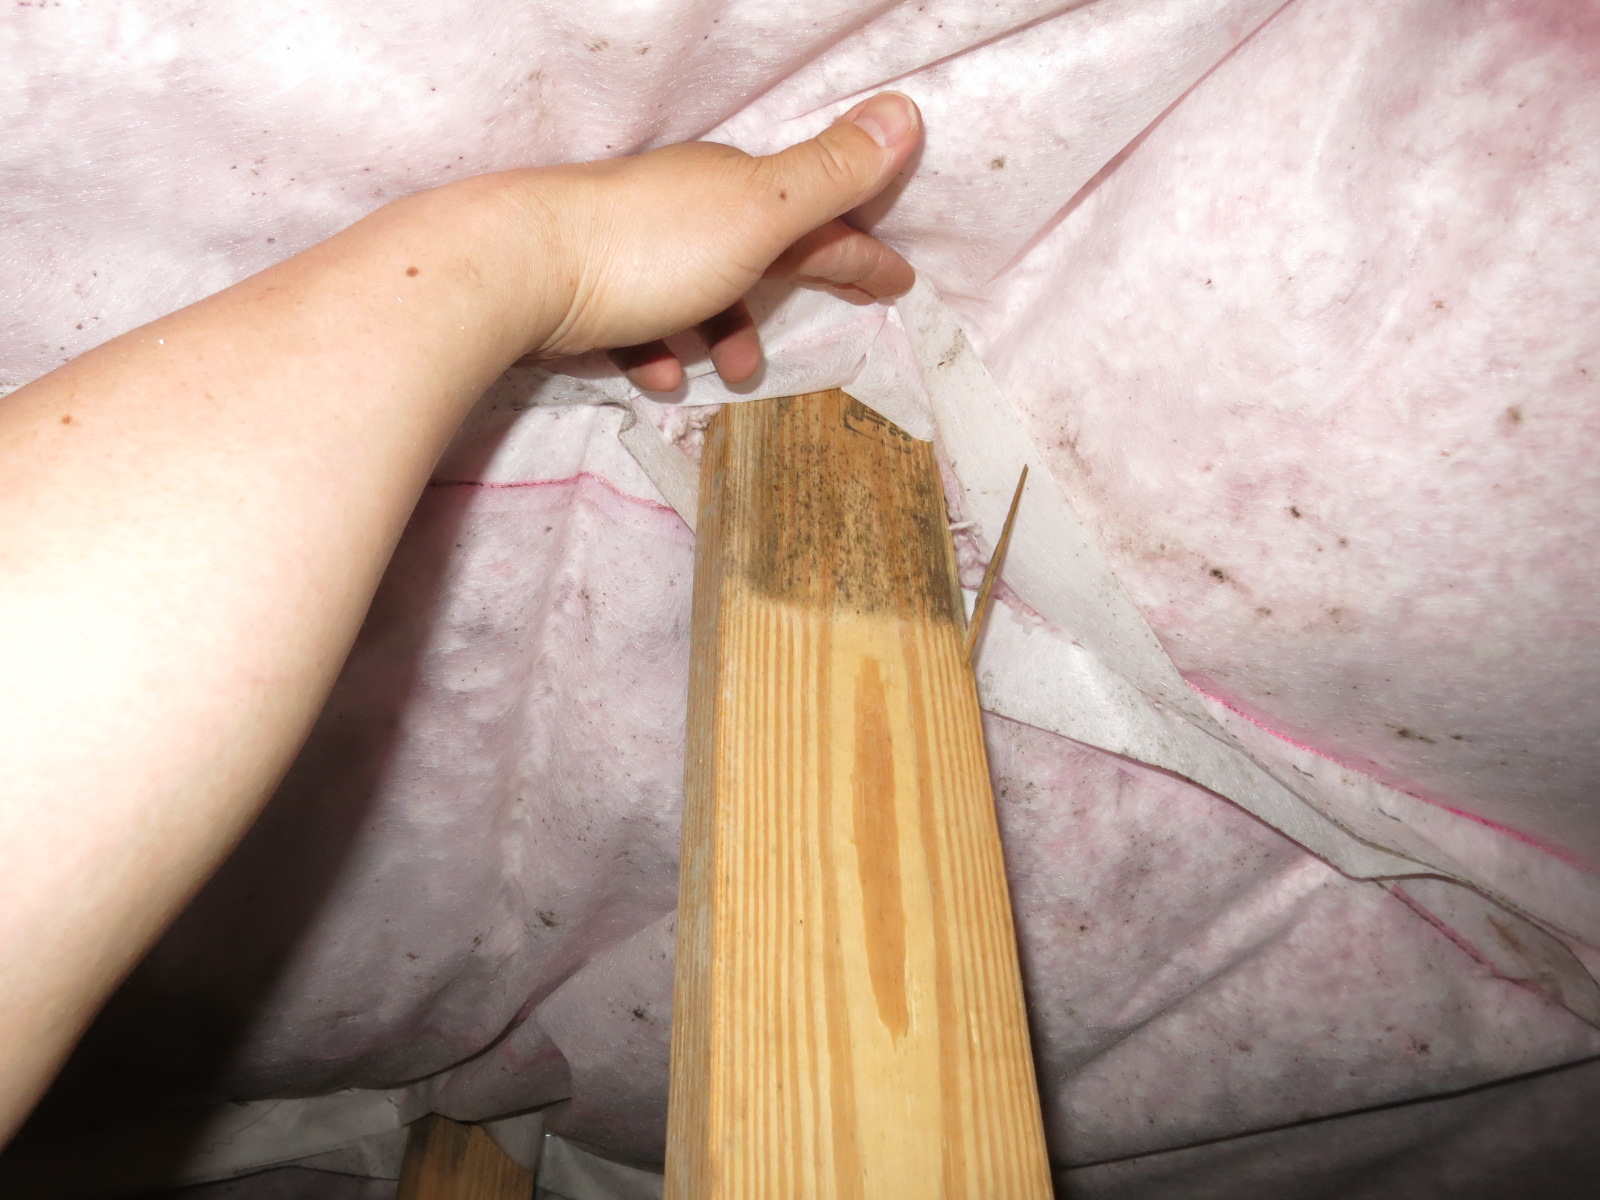
Figure 9: Mold on truss top vertical member
We used a T/RH meter to directly measure the temperature and stratification in the attic over the height, from the ridge down to the attic floor (Figure 10), with the results plotted in Figure 11. It shows the temperature in orange, and the dewpoint (absolute air moisture content) in blue. It’s clear that there’s temperature stratification (warm air rises), and very strong moisture stratification. The relative humidity during these measurements was 90%+ near the ridge.
If you’re wondering about the little “tail” discontinuity at zero (attic floor), that shows conditions above and below the gypsum board ceiling—the interior space is cooler and drier inside than the conditioned attic space, which makes sense.
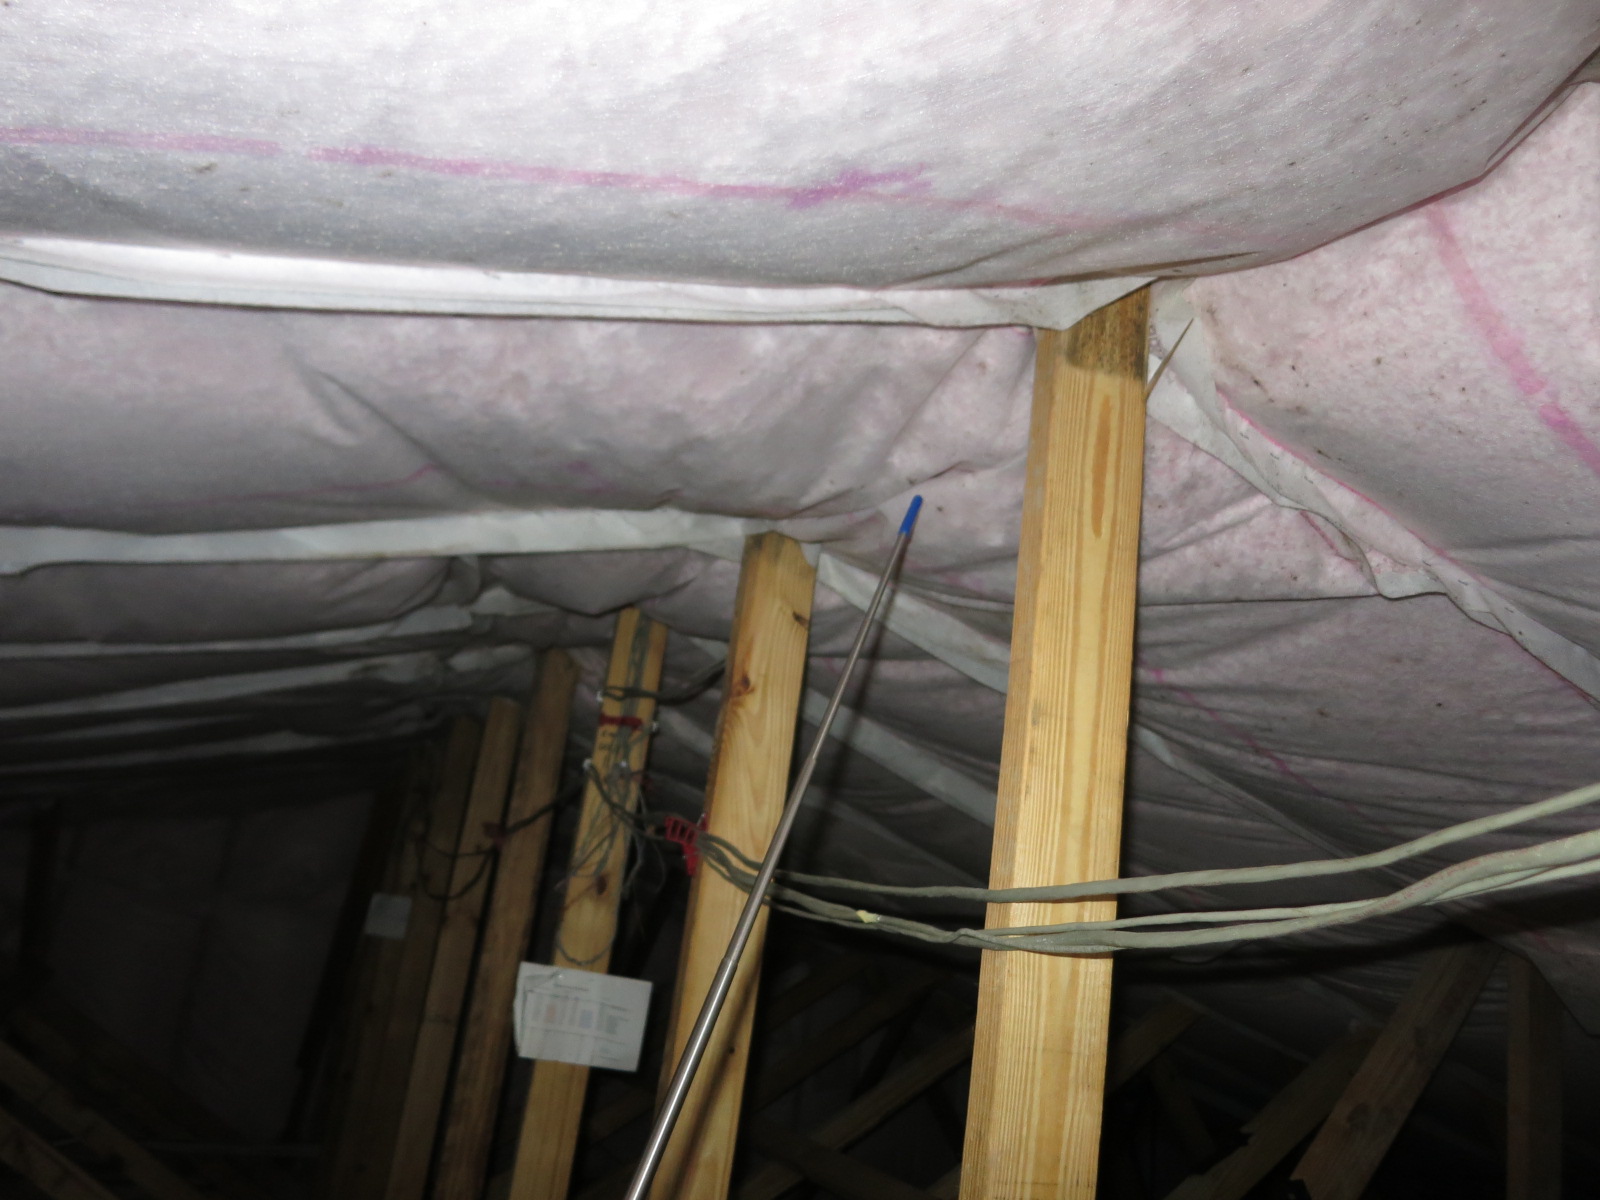
Figure 10: Measuring T and DP stratification
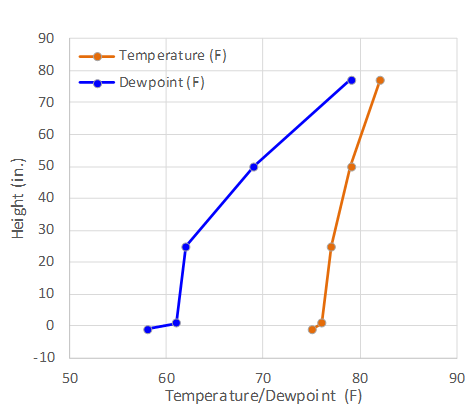
Figure 11: Direct measurement of unvented attic thermal and moisture stratification
HVAC Measurements: What’s the Split?
My common use for T/RH meters is to diagnose the health of HVAC (specifically cooling) systems. I have been dealing with more and more high summertime indoor humidity problems in commercial and multifamily residential buildings. Many of them are due to a combination of outdoor air leakage, building depressurization, vinyl wallpaper/vapor-impermeable wall coverings, and excess ventilation rates. But in some of them, cooling systems that aren’t dehumidifying contribute to the problem.
The diagnostic test is known as “measuring the split” across the cooling unit or measuring the supply and return air conditions. This can be done by drilling holes in the return and supply plenum ducts and inserting T/RH probes (Figure 12 and Figure 13).
This is where the Fieldpiece dual-probe meter shines—you don’t need to swap probes between the return and supply and wait for them to settle down for a measurement. The meter also directly displays the temperature, RHs, and dewpoint.
You can also stick the probes into nearby supply and return registers/grilles, depending on the ductwork geometry (Figure 14 and Figure 15). But this measurement will be thrown off if the supply ducts run through an unconditioned attic and pick up heat as cooling air flows through them.
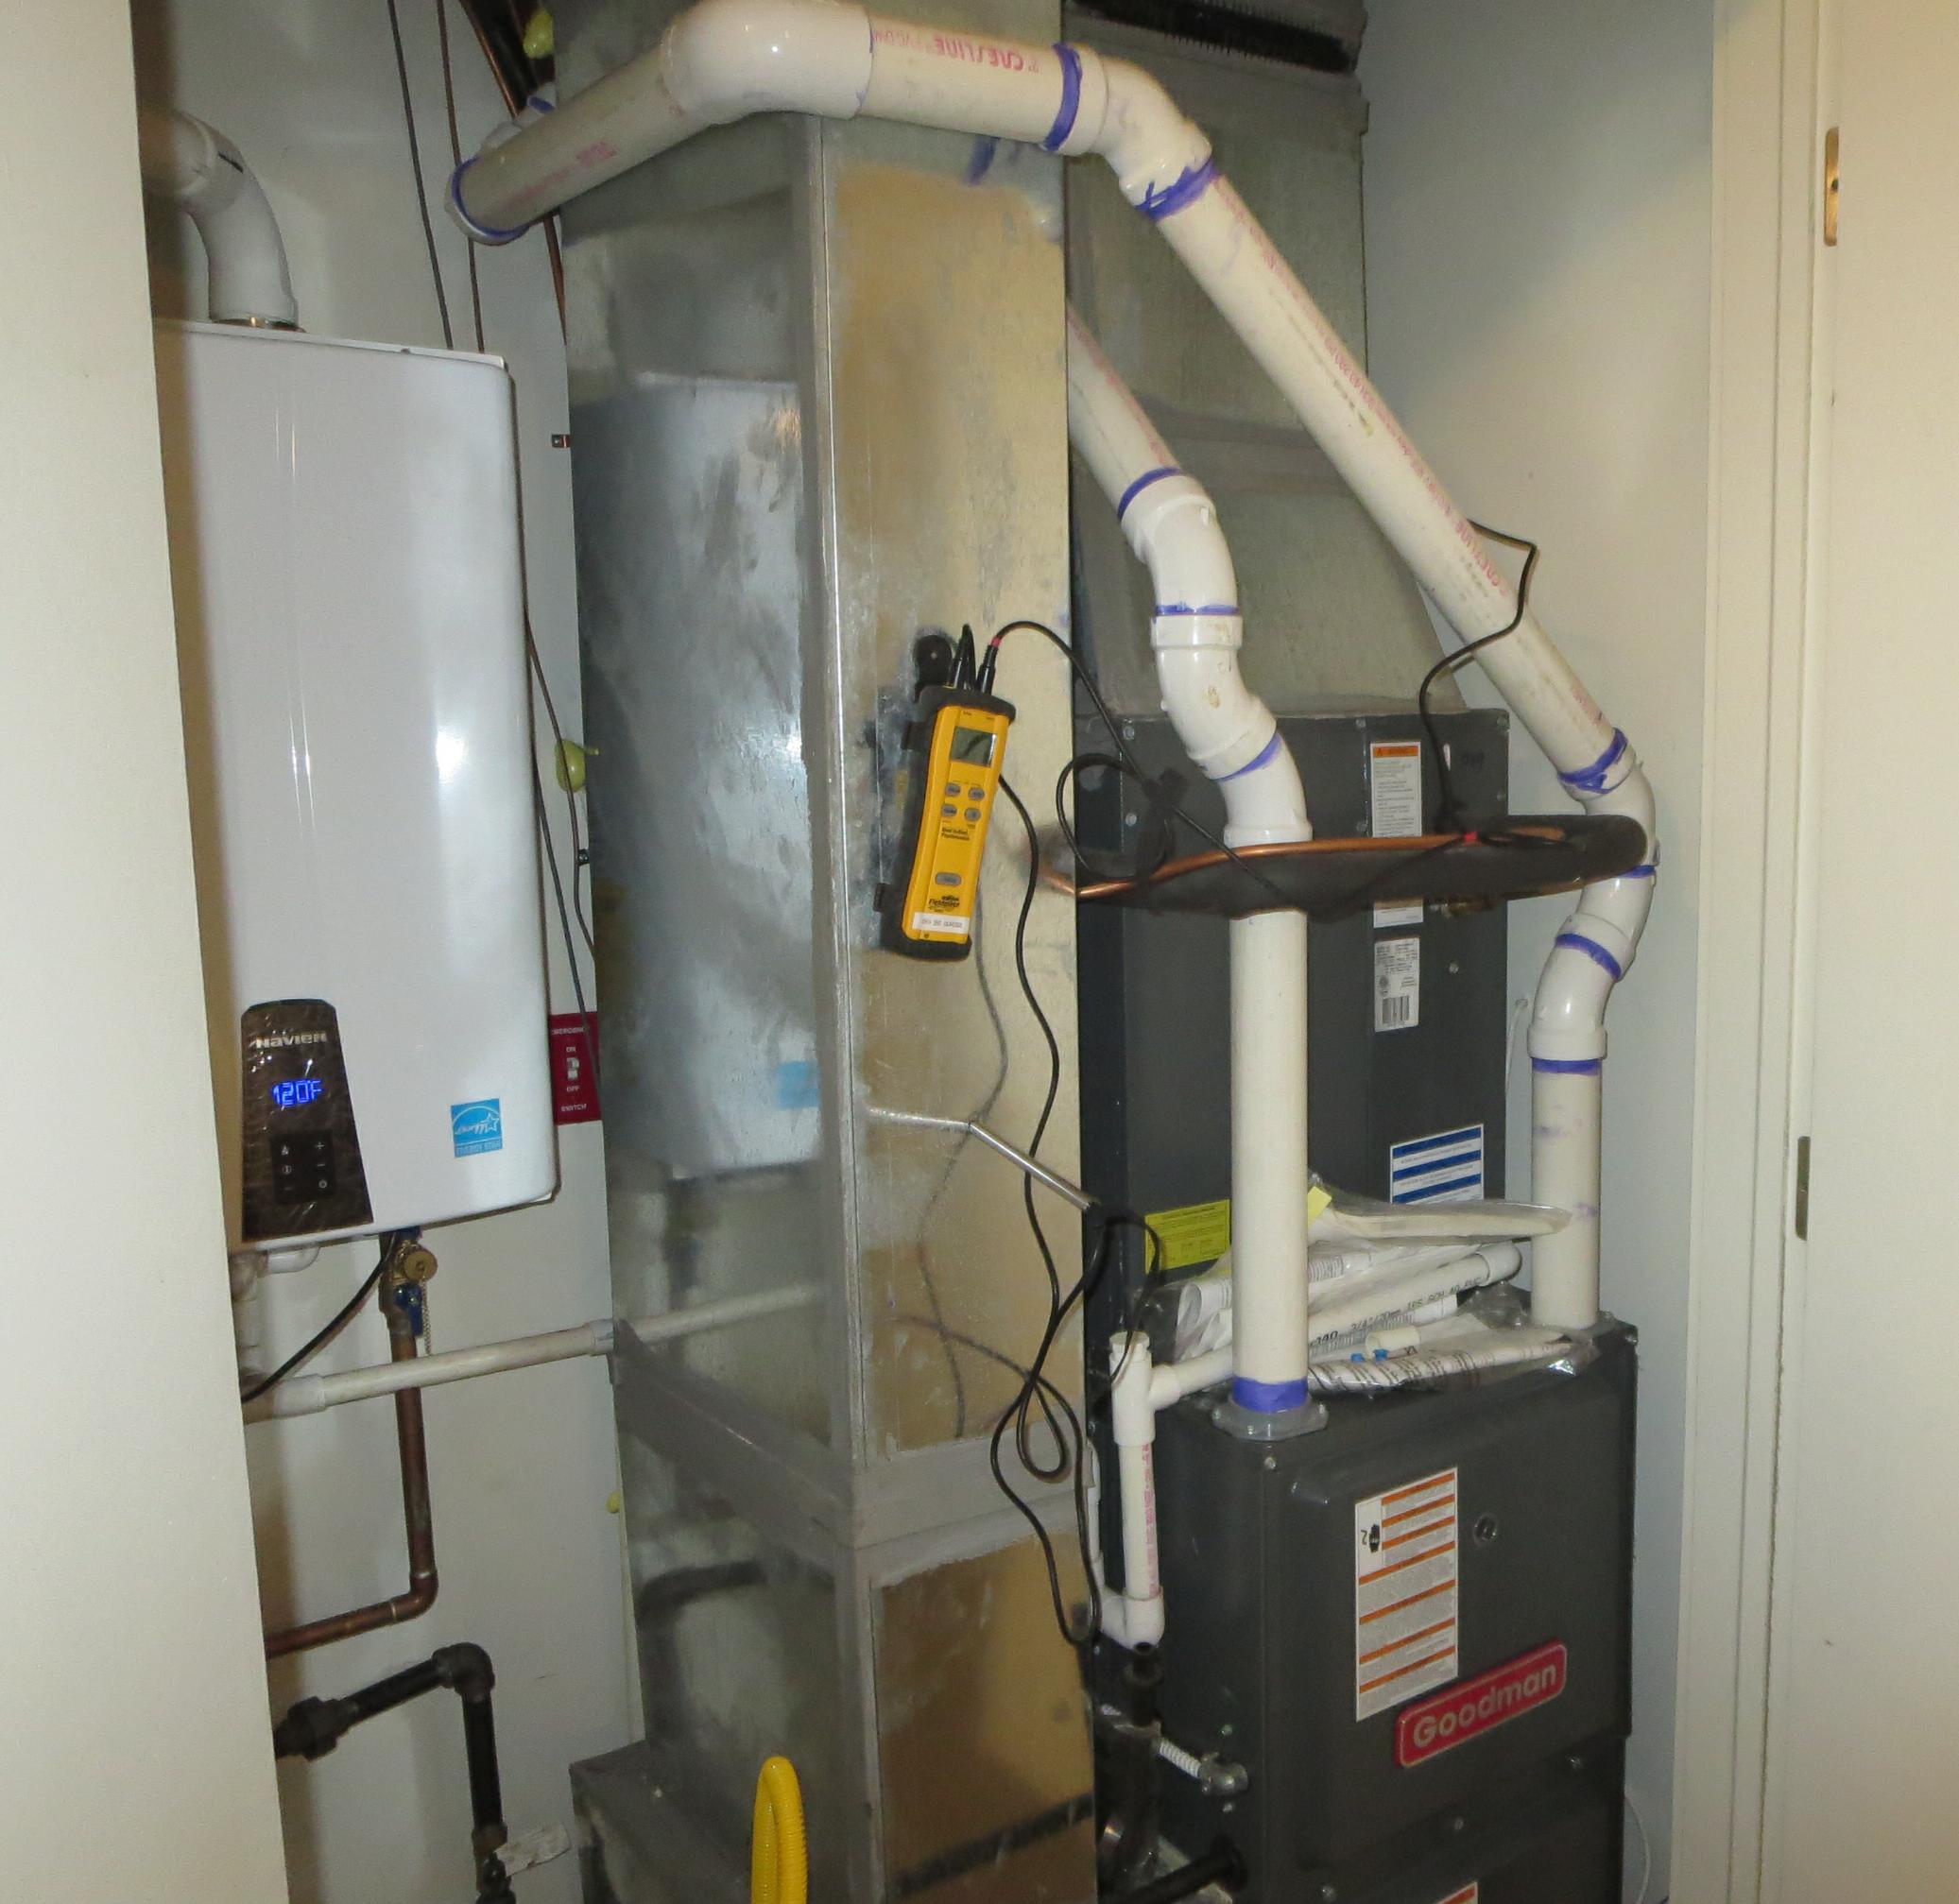
Figure 12: Temperature “split” across an AHU

Figure 13: Measuring “split” across an AHU
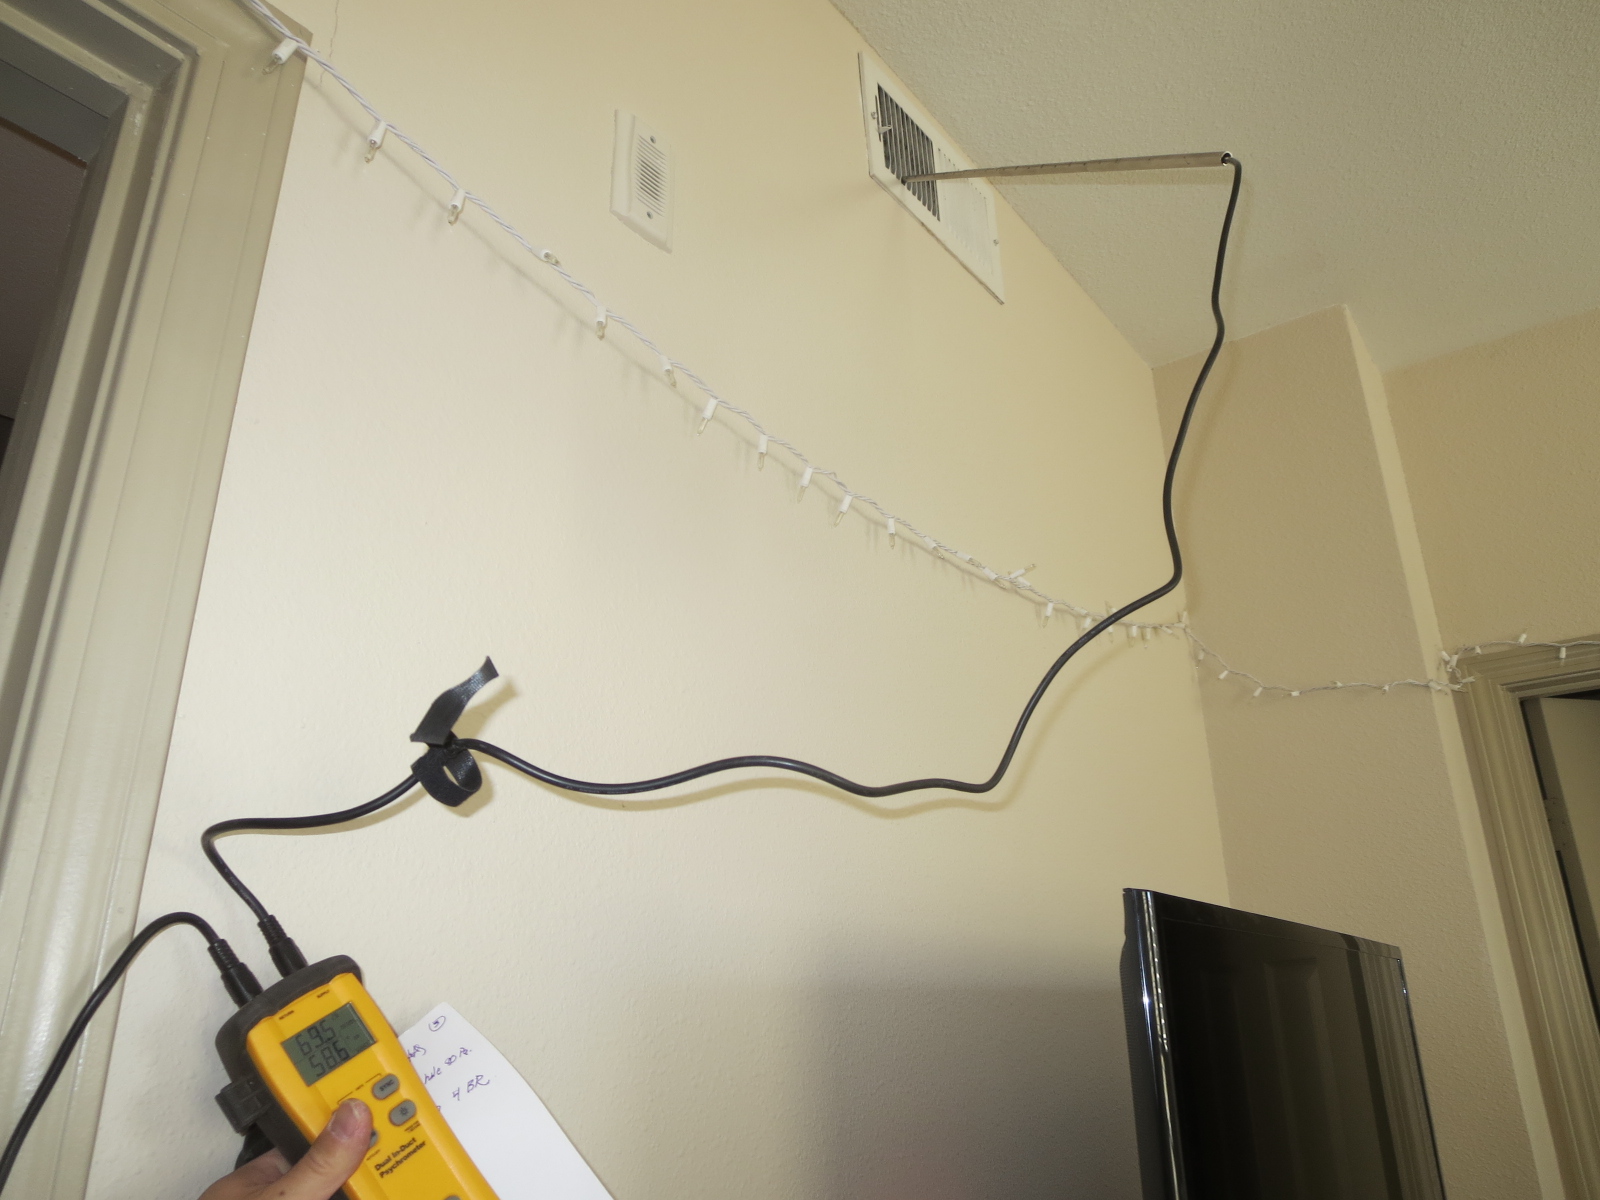
Figure 14: Measuring “split” at supply
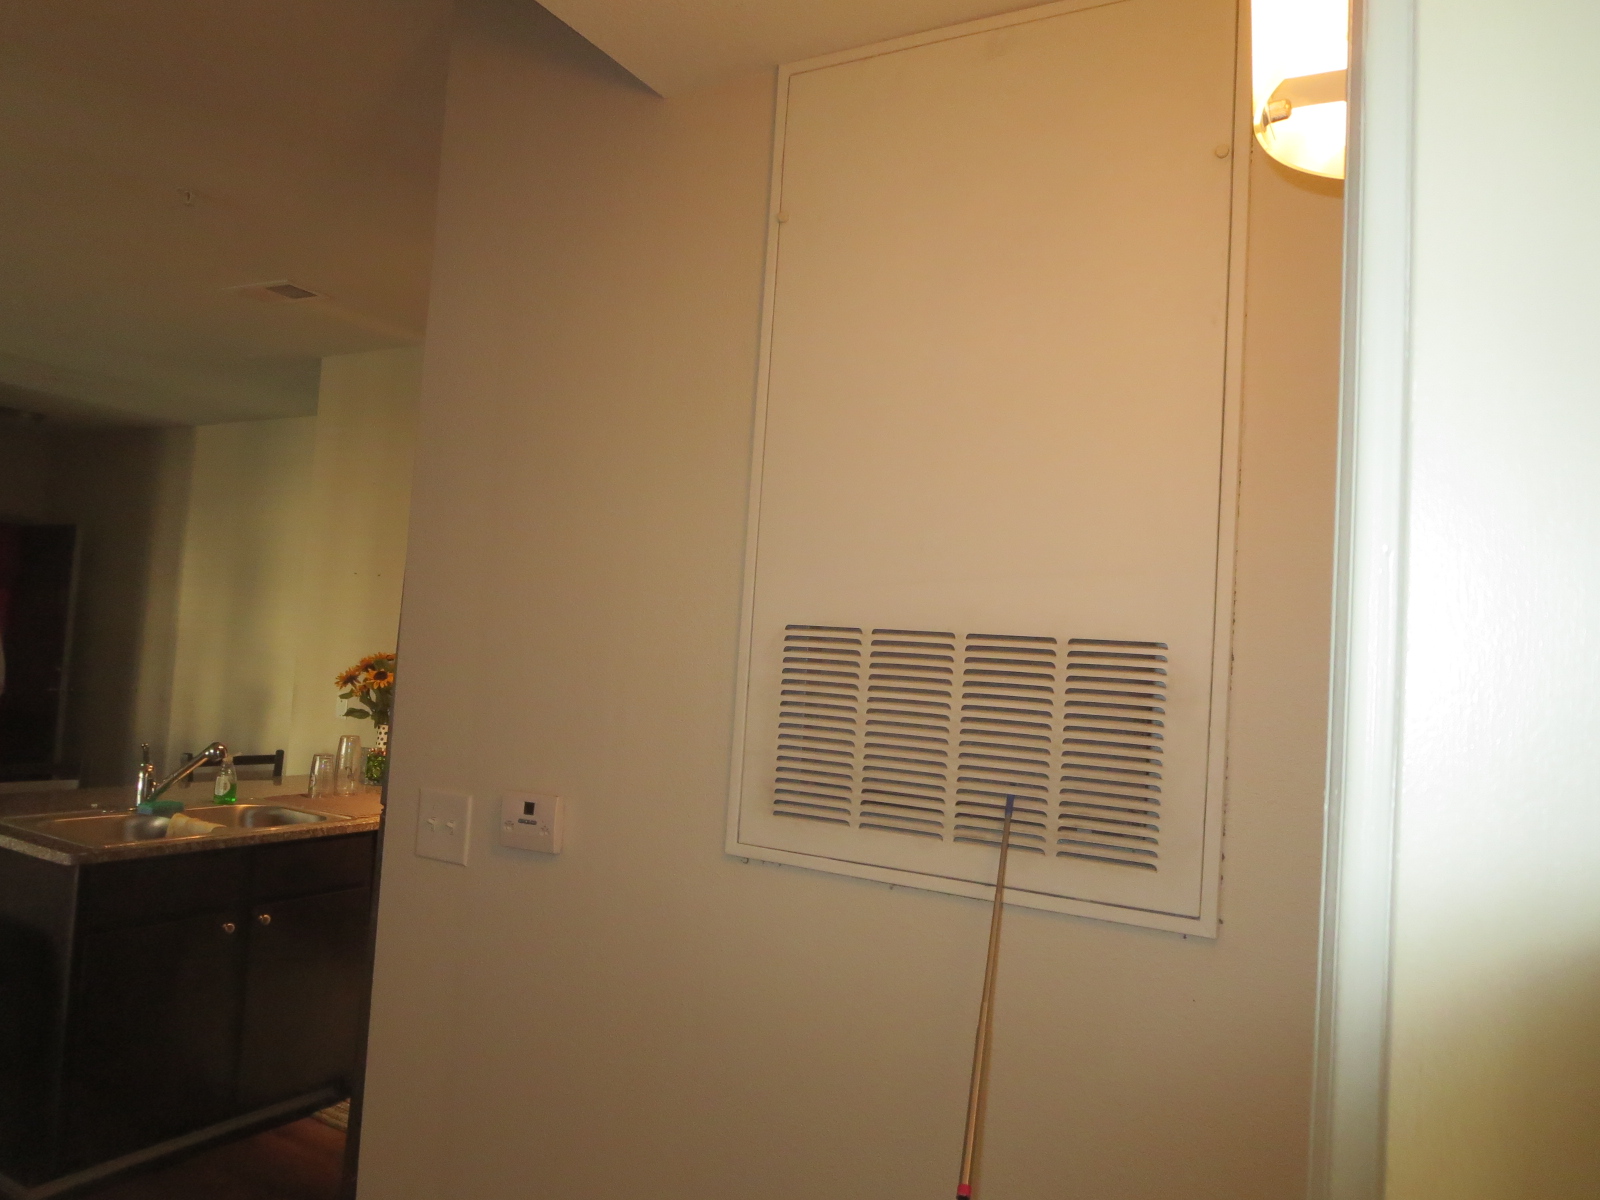
Figure 15: Measuring “split” (return grille)
The target “temperature split” (supply-return temperature difference) is 18°F-20°F. Specifically, we need to cool air down to ~55°F (from ~75°F) to reach an air dewpoint lower than 55°F. We need dewpoint temperatures this low to achieve the target comfort conditions of 75°F/50% RH; a system can only create this comfort condition by supplying air drier than the target condition.
Examples of these split measurements are shown in Figure 16, which show measurements of several HVAC units in a building. Units 1 and 2 have good splits of 18°F; however, Units 3, 6, 7, and 8 have middling to poor temperature splits (7-12°F). The table also shows measurements of the dewpoint difference (ΔDP), which directly measures the system’s moisture removal. Units 1 and 2 do reasonably well, while Units 3, 6, 7, and 8 have much lower moisture removal.
These “low split” problems are often not obvious to occupants because cooling systems are often oversized—especially during part-load conditions (i.e. most of the summer). As a result, the systems can reach temperature setpoint even if they’re putting out air much warmer than they should be, but without doing much moisture removal. The common causes for these problems include bad refrigerant charge or excess airflow, discussed further below.
Another cooling and dehumidification issue we have seen is running cooling systems in continuous fan mode. The esteemed Dr. Allison Bailes already wrote all about this. In short, if you run a cooling system in continuous fan mode, once the cooling shuts off, the moisture that is on the indoor coil is re-evaporated back into the space, defeating much of the system’s dehumidification capacity. Instead, for best dehumidification performance, air handler fans should be run in “fan cycling” mode, where the fan is only run when cooling is active.
One demonstration was measurements on packaged terminal air conditioner (PTAC) units—the systems that you typically see in hotel rooms (Figure 17). The results (Figure 18) show that when the system is running in cooling mode, you get a great split (17-20°F) with excellent dehumidification (ΔDP 13-15°F). But with the cooling off and the fan still running, the ΔDP shows you’re adding moisture back into the room, rather than removing moisture.
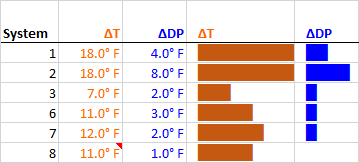
Figure 16: Measurement of ΔT and ΔDP across multiple air handlers
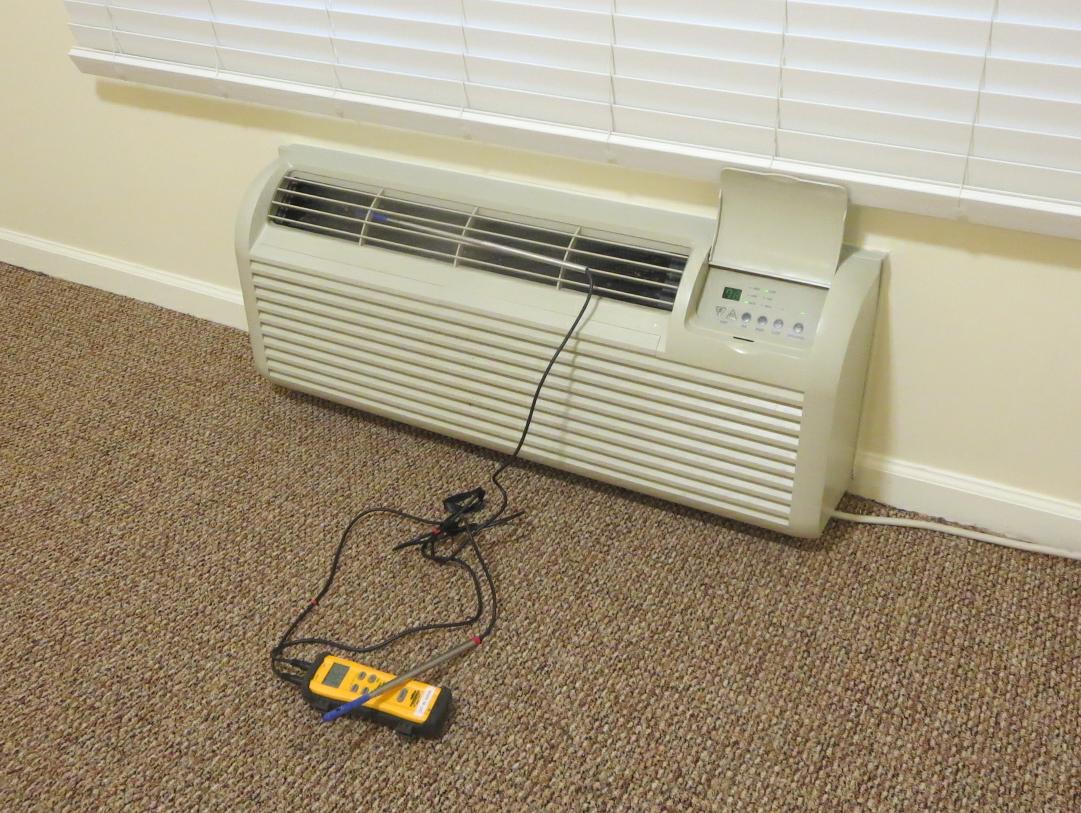
Figure 17: Measuring a PTAC supply and return
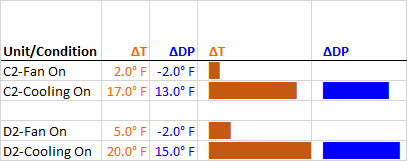
Figure 18: Measurement of ΔT and ΔDP across multiple PTAC units
This is a more common problem than it should be because many PTACs are factory-configured to run in continuous fan mode: you need to dig into the control board switches to shut it off.
Lastly, many multi-splits or variable refrigerant flow/VRF systems are also set to run in the same continuous fan mode; we saw the same moisture removal problems in these ceiling-mounted multi-split units (Figure 19 and Figure 20). Again, you have to dig deep into the service manual settings to figure out how to shut it off.
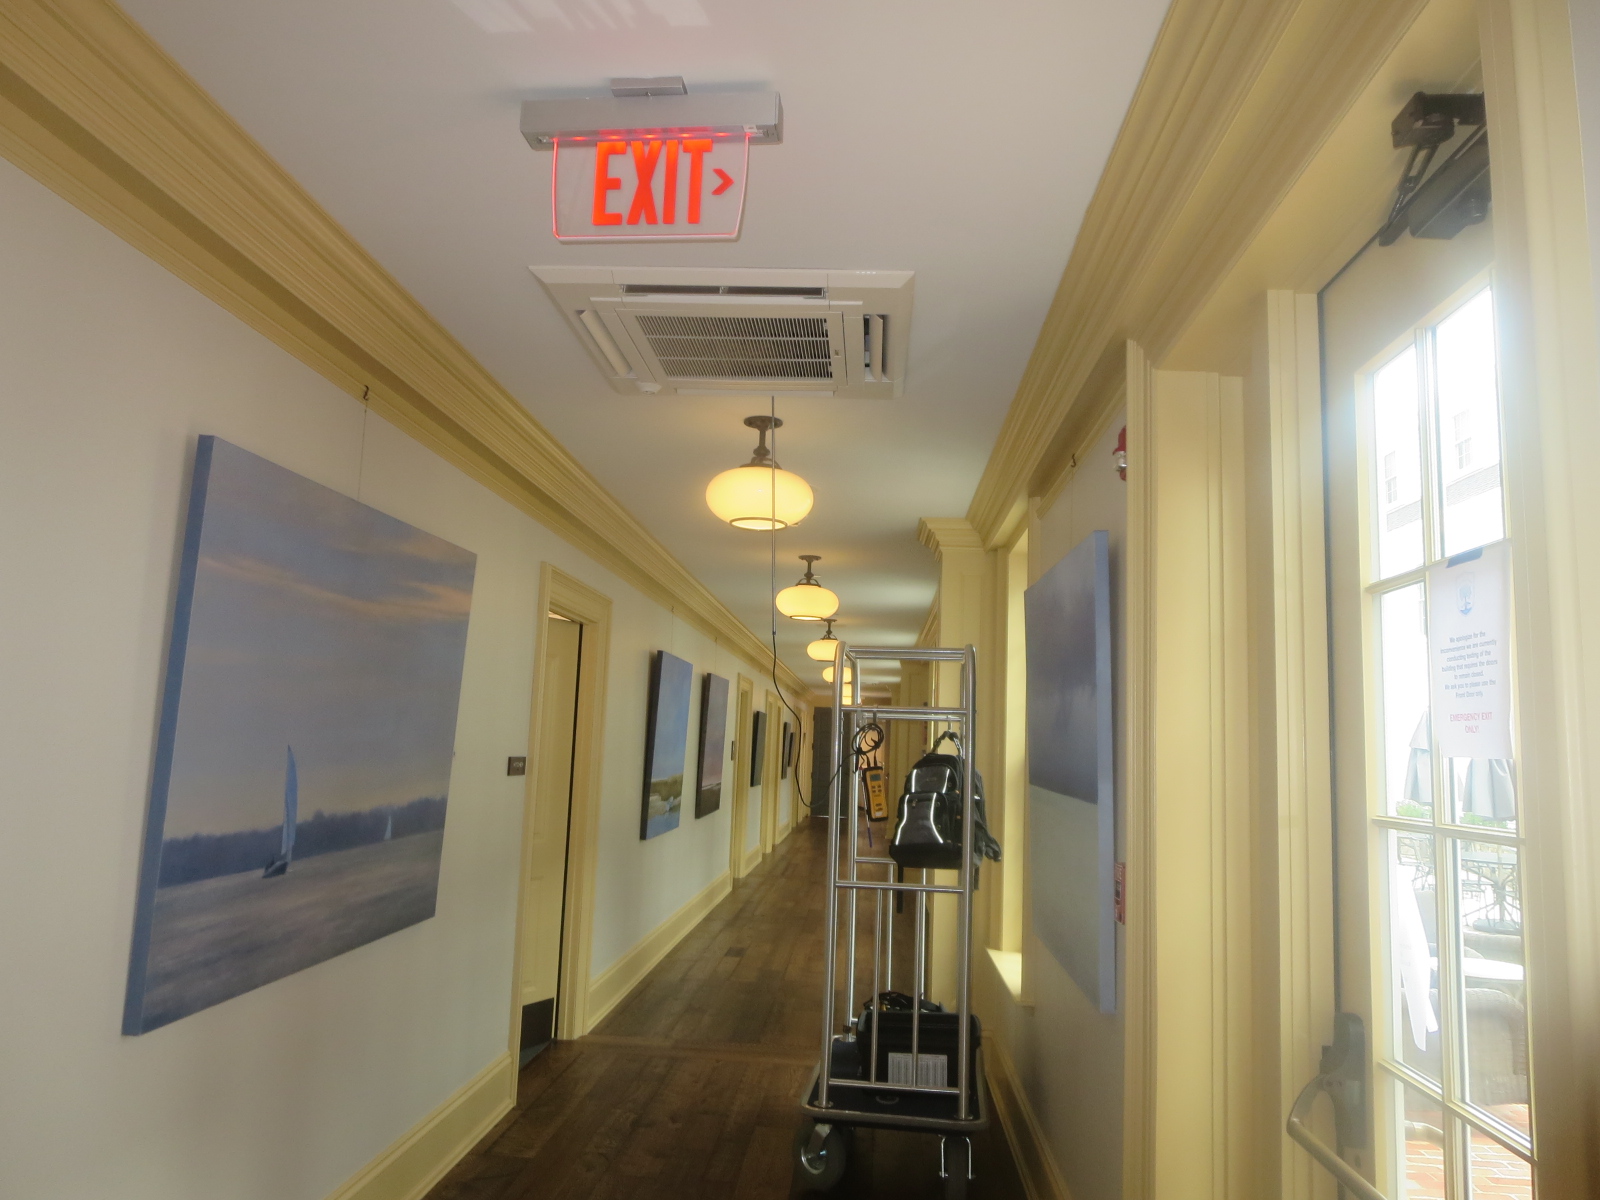
Figure 19: Measuring a recessed ceiling multi-split
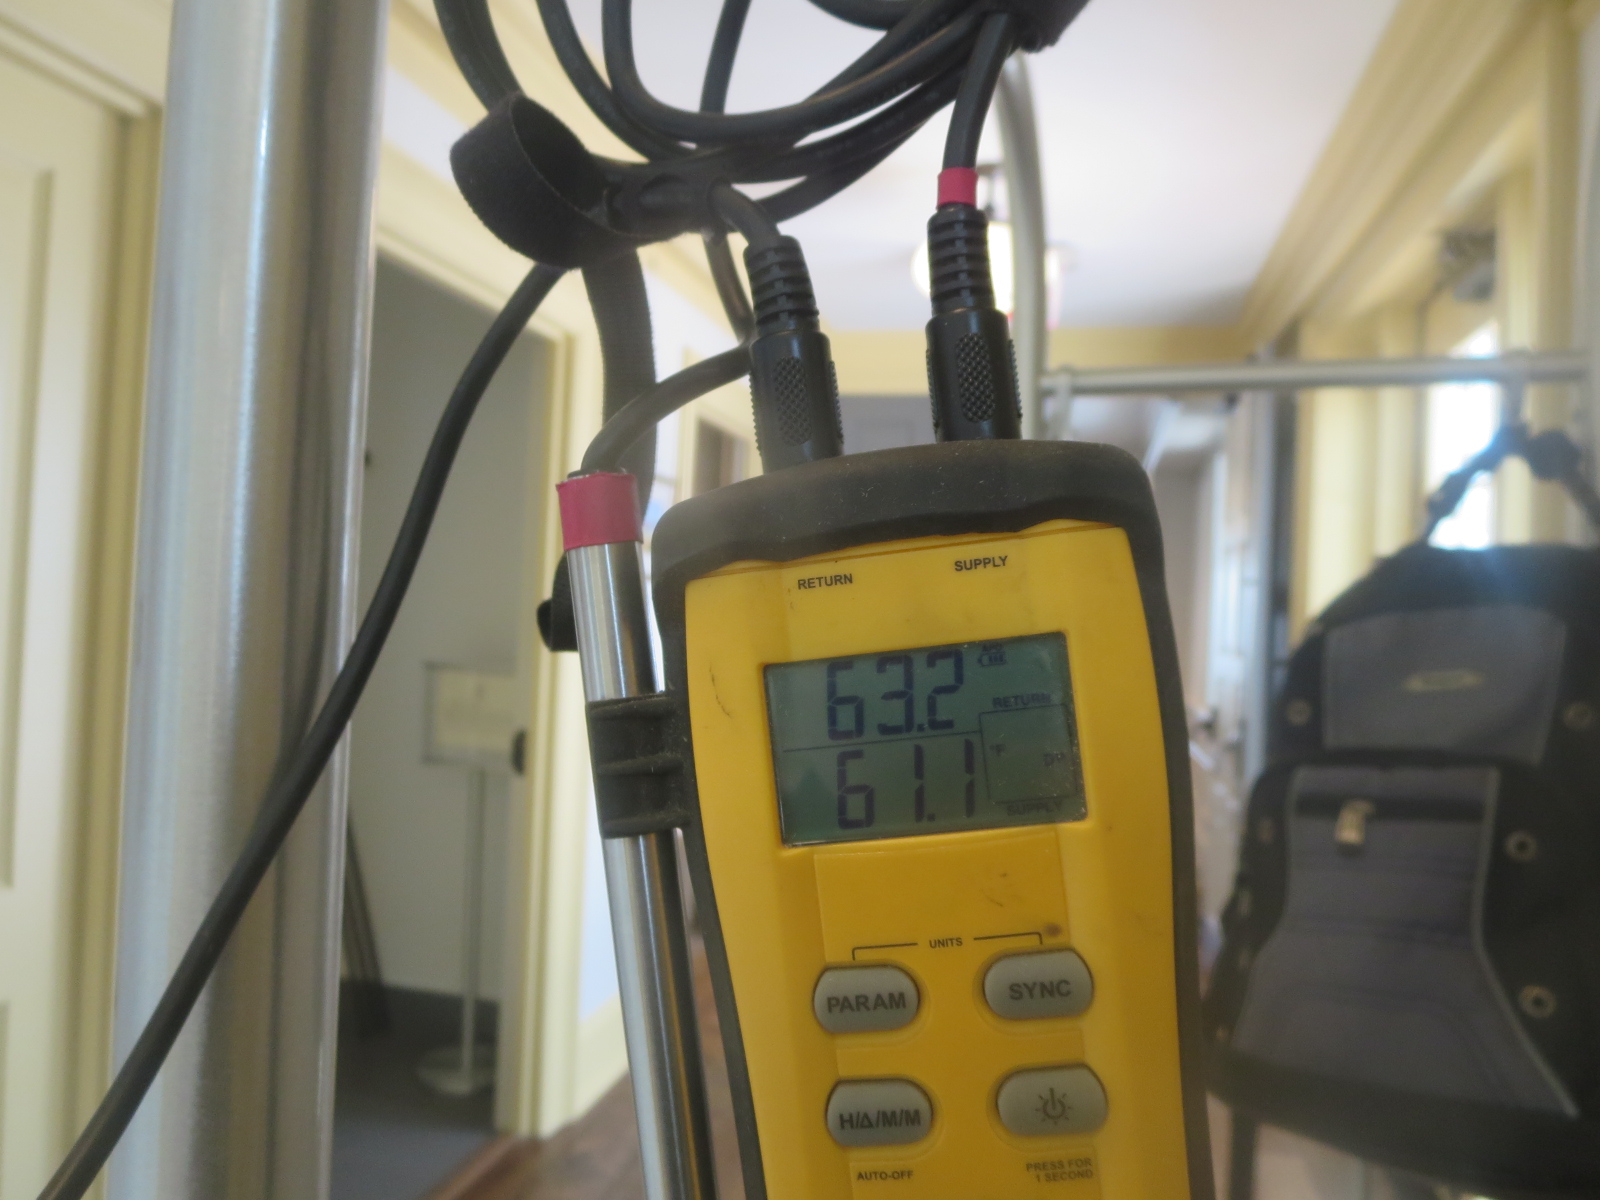
Figure 20: Measuring a recessed ceiling multi-split
The Air Side of HVAC
Lastly, if we’re talking about diagnosing HVAC systems, we should discuss measurements of the air-related aspects.
One common measurement is air handler static pressure or external static pressure (ESP). To measure it, you take pressure measurements upstream and downstream of the air handler (Figure 21) and add up the negative (return) and positive(supply) pressures. Most manufacturers recommend installations with a maximum staticpressure of 125 Pascals (0.5 “inches of water column”) or less. Measurements in the field show that many systems exceed this target, which indicate that the air handlers are trying to force too much air down a constricted/too small ductwork system.
I refer to a static pressure test as a tongue depressor test: your doctor isn’t going to figure out you have an advanced autoimmune disease by looking down your throat, but he or she will be able to get some first impressions and data. A static pressure measurement is a quick indicator whether the ductwork and HVAC systems are facing some serious problems.
Sharp-eyed readers will note that I have my pressure probe in the return duct, but that the correct spot for a return measurement is between the filter and the air handler. I typically get measurements from both spots. The other tricky part is that the supply measurement should be taken between the air handler and the cooling coil, where there’s often no intentional opening. Typical tricks include removing the furnace high-limit switch, or popping open an unused cooling coil drain connection.
Another “air side” HVAC measurement is whole system flow—I talked about measuring airflow at registers in Part 1. The quickest way to get this airflow measurement is with an Energy Conservatory TrueFlow Air Handler Flow Meter (Figure 22), which is a plate that slides into the filter slot in place of the typical filter.
Figure 21: Measuring static pressure
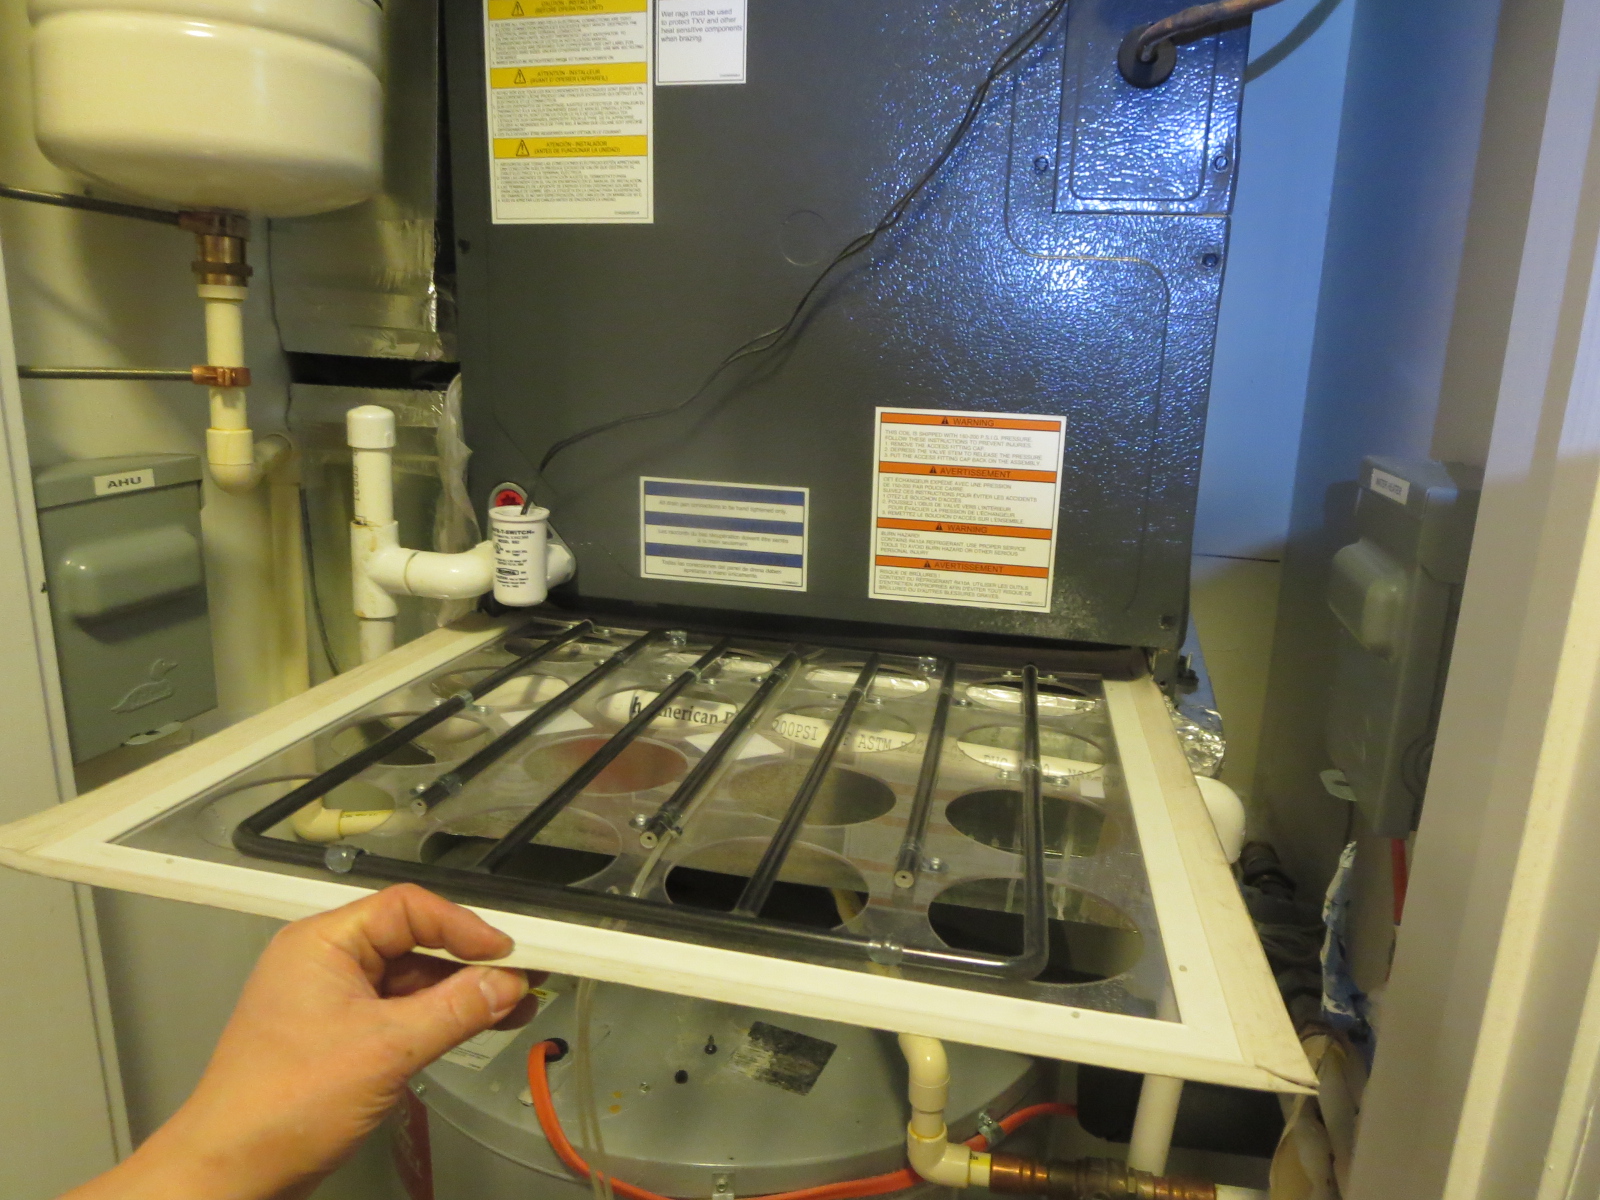
Figure 22: Energy Conservatory TrueFlow meter
One reason to measure air handler airflow is to see if it contributes to cooling and dehumidification problems. Dehumidification performance is governed by the ratio of the airflow over the coil compared to the cooling input. This is typically stated as the metric of “CFM per ton” or airflow per unit of cooling (1 ton = 12,000 Btu/hour). TypicalCFM/ton levels with their associated conditions are summarized below; the concept is that pushing the air “low and slow” over the cooling coils gives it more time to cool down and wring the moisture out of the air.
- 400 CFM/ton:This is normal operating condition for most AC units
- 450 CFM/ton:Results in higher efficiency, but worse humidity removal (used in hot dry climates)
- 325-350 CFM/ton:Results in lower overall efficiency, but much greater humidity removal
In addition, current DOE research shows that residential equipment can be operated down to 245 CFM/ton without creating issues, which would substantially improve dehumidification.
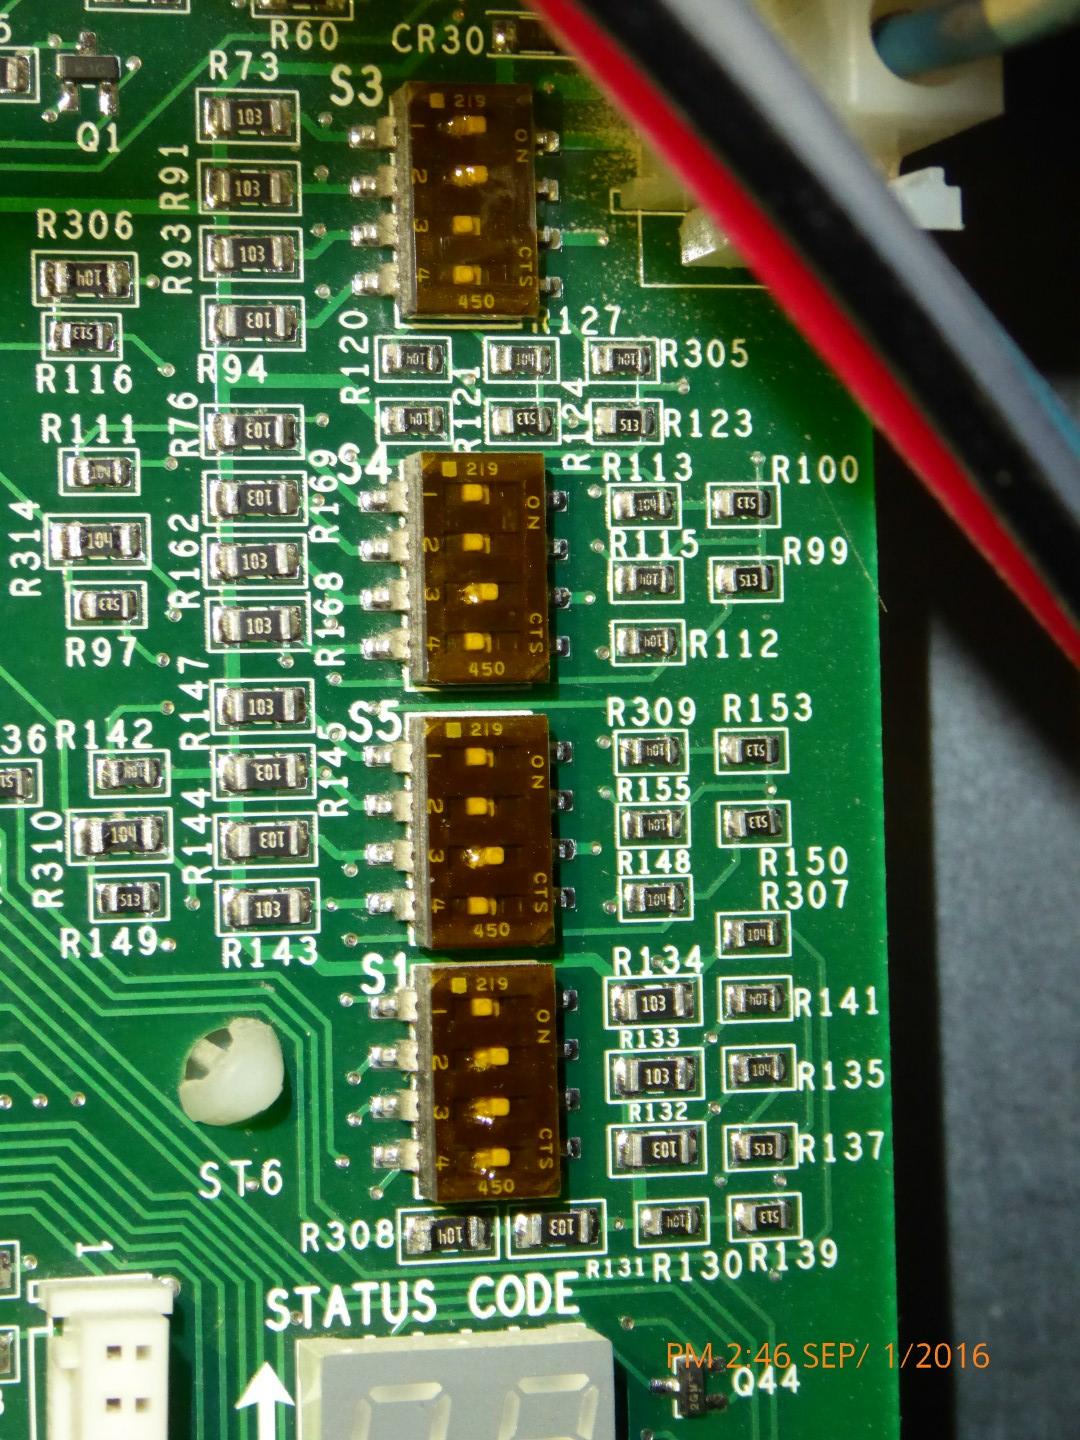
An example of what I’ve found with these measurements is an investigation of humidity problems in a multifamily building. The individual apartments had 1 1/2-ton outdoor cooling units with 40,000 Btu/hour furnaces (Figure 23)—the smallest commonly available sizes. However, the furnaces are factory-configured to connect to 2-ton outdoor units, resulting in 560 CFM/ton airflows—and thus lousy dehumidification. Changing this setting requires digging into the manual and flipping DIP switches on the control board (Figure 24)—simple enough, but outside of what the installers knew to deal with. Dropping the airflows down to 360 CFM/ton brought dehumidification back to where it should be operating.
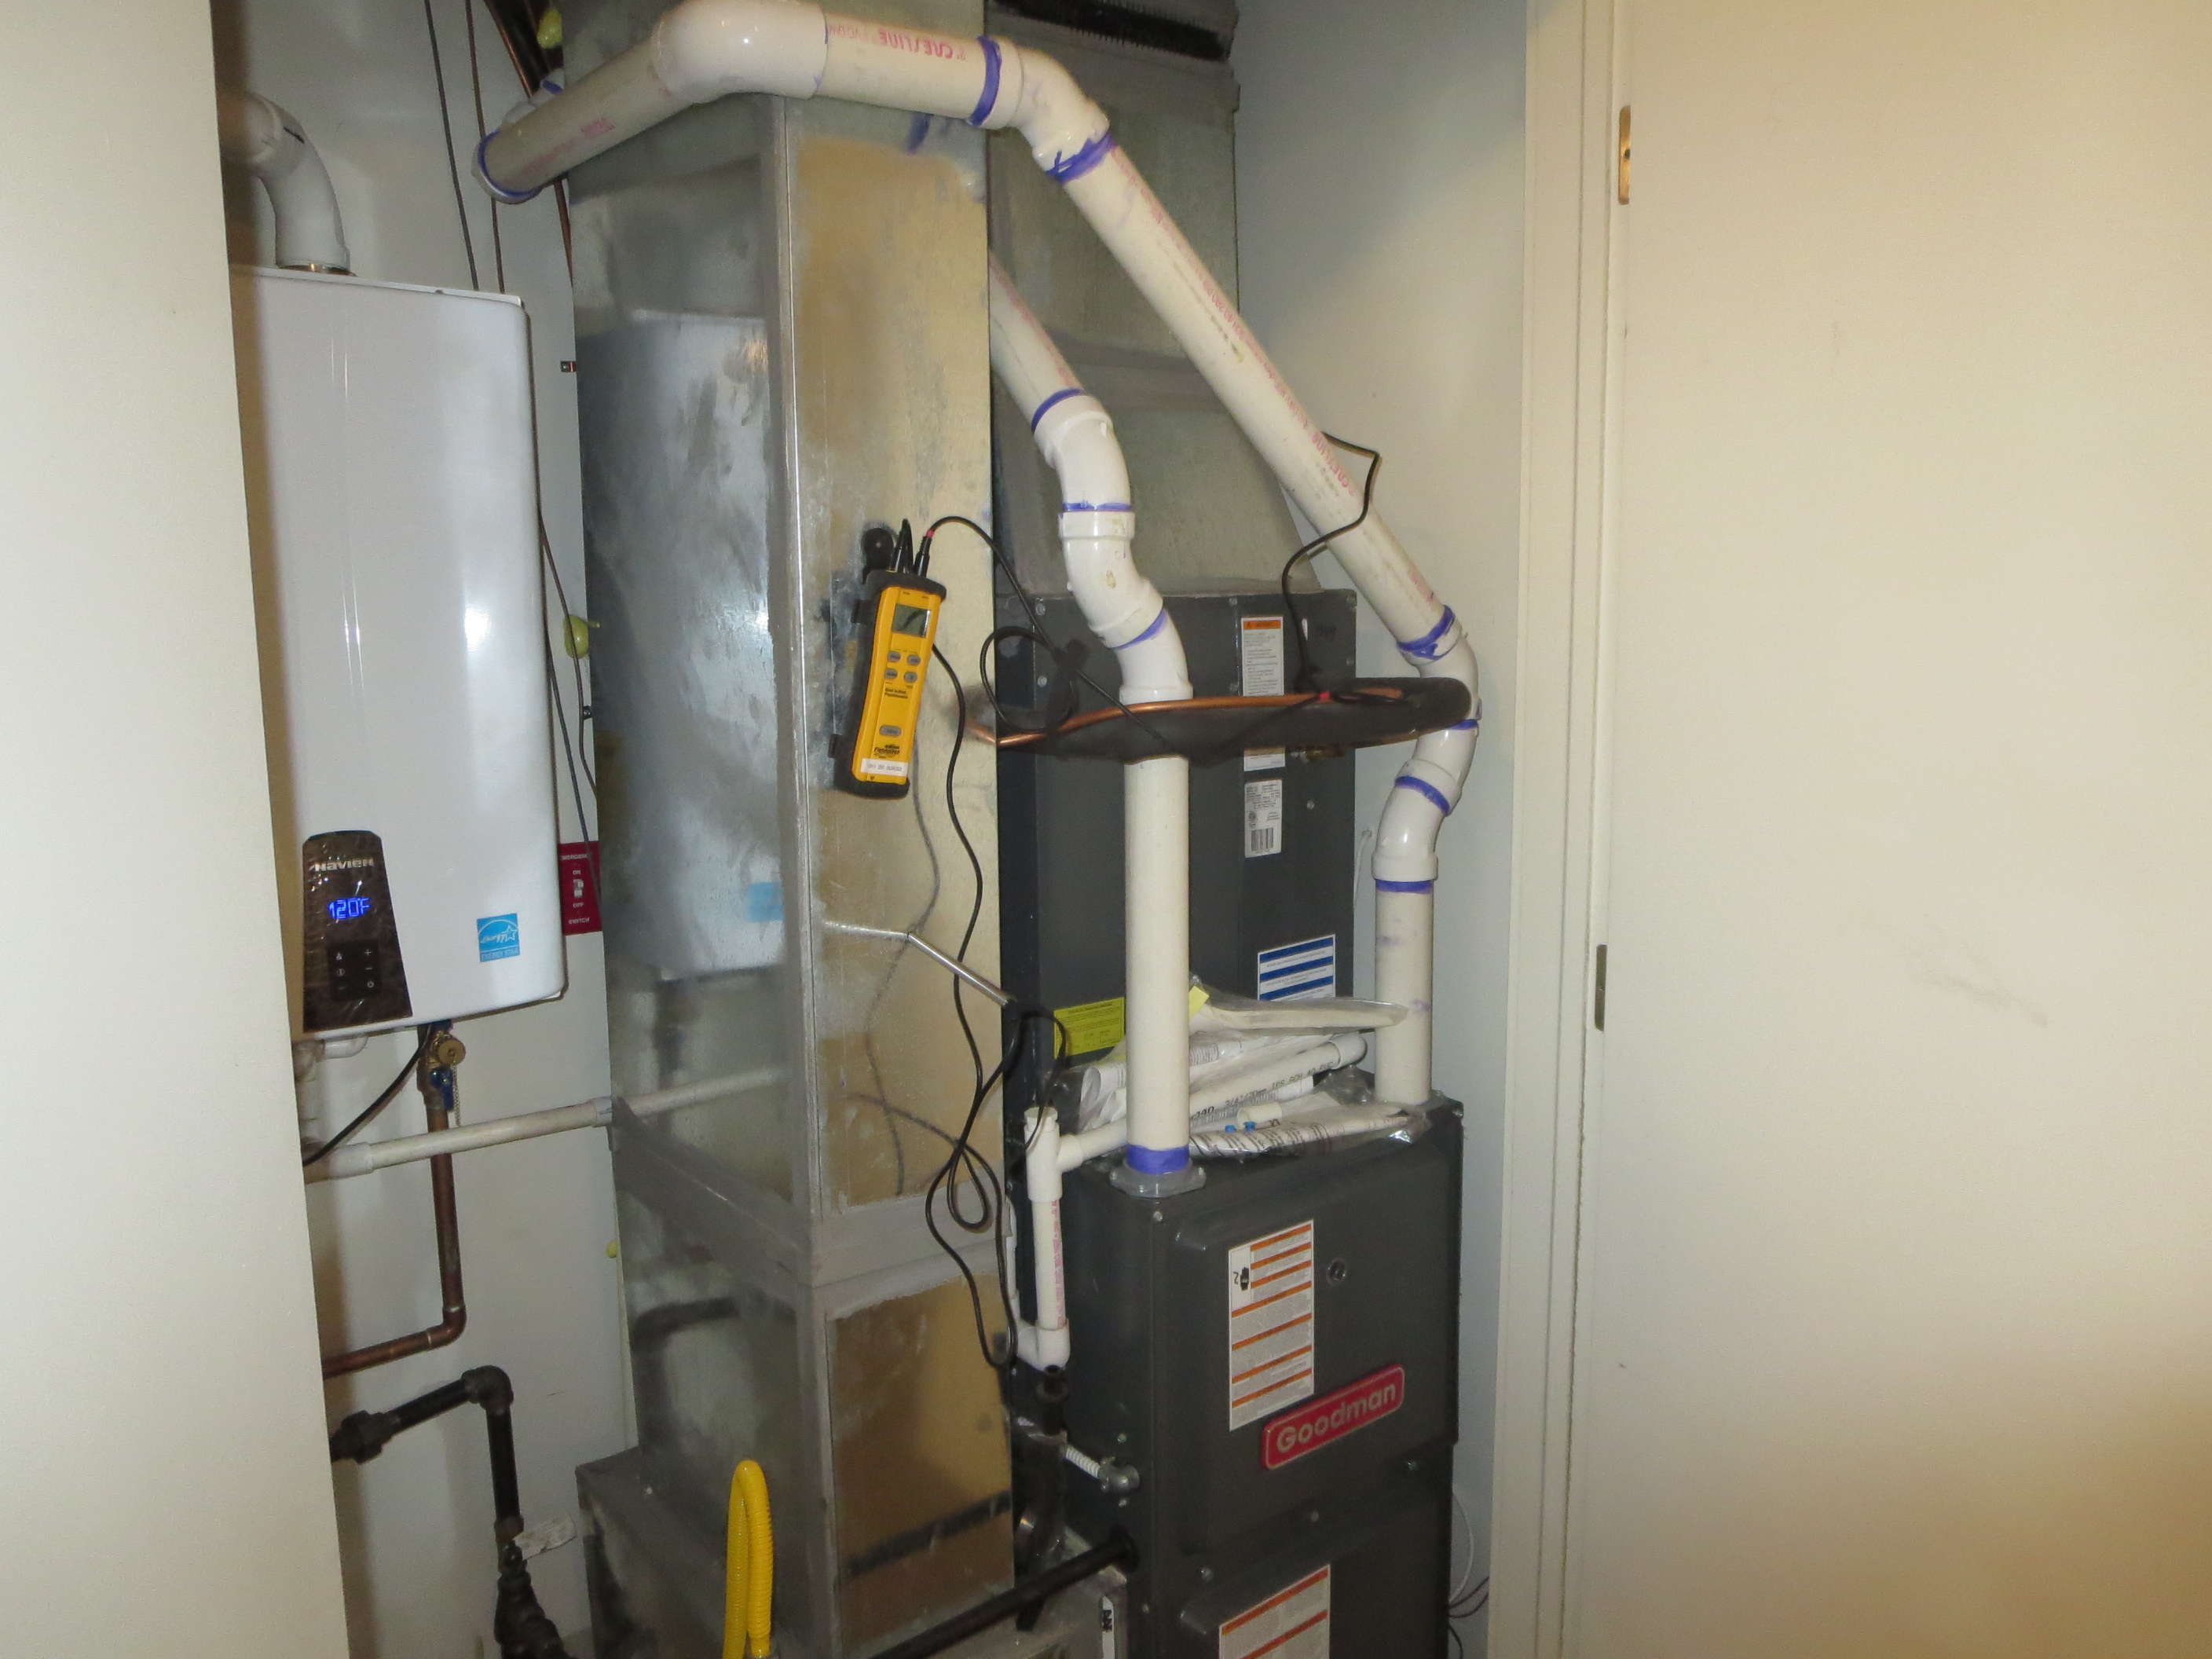
Figure 23: Air handler closet in apartment units