A nuanced look at thermal imaging and how it can shed light on much more than heat loss.
Introduction: Measuring Heat… or Temperature
I’m back to share more tools of the trade that I use for forensic examinations and to diagnose problems in buildings. (see Part 1 for more background https://www.greenbuildingadvisor.com/article/how-to-look-at-a-house-like-a-building-scientist-part-1-air). The rough breakdown of these columns will cover the topics of air, heat, and moisture and the tools I use to identify how they are acting in a building. This time, we’re looking at heat, or more specifically temperature.
One of my go-to tools in investigations is an infrared camera, which is the focus of this column. IR cameras are not always problem solvers, but they often pick up anomalies that are useful clues… or otherwise provide entertaining stories. This isn’t intended as infrared cameras 101: there are plenty of training classes you can find on that front. But IR cameras are incredibly useful for scanning wide areas for cold spots, hot spots, and other “thermal anomalies,” as we call them in reports.
Examples of Infrared Observations
First: to interpret infrared images, a color (or black and white) scale is used to represent surface temperatures. In the images below, I used a color scale where blue/purple are cooler temperatures, and yellow/orange are warmer temperatures.
As a first warning: there are plenty of times when my first glance at the infrared image resulted in the wrong answer. For instance, I walked into this house in rough frame, and was startled by the big warm thermal anomalies across the floor (Figure 1). Was heat running already, resulting in duct conduction through the floor? Nope… those are just the sunlit spots on the floor from the windows, and it wasn’t obvious at first because the sun had gone behind a cloud.
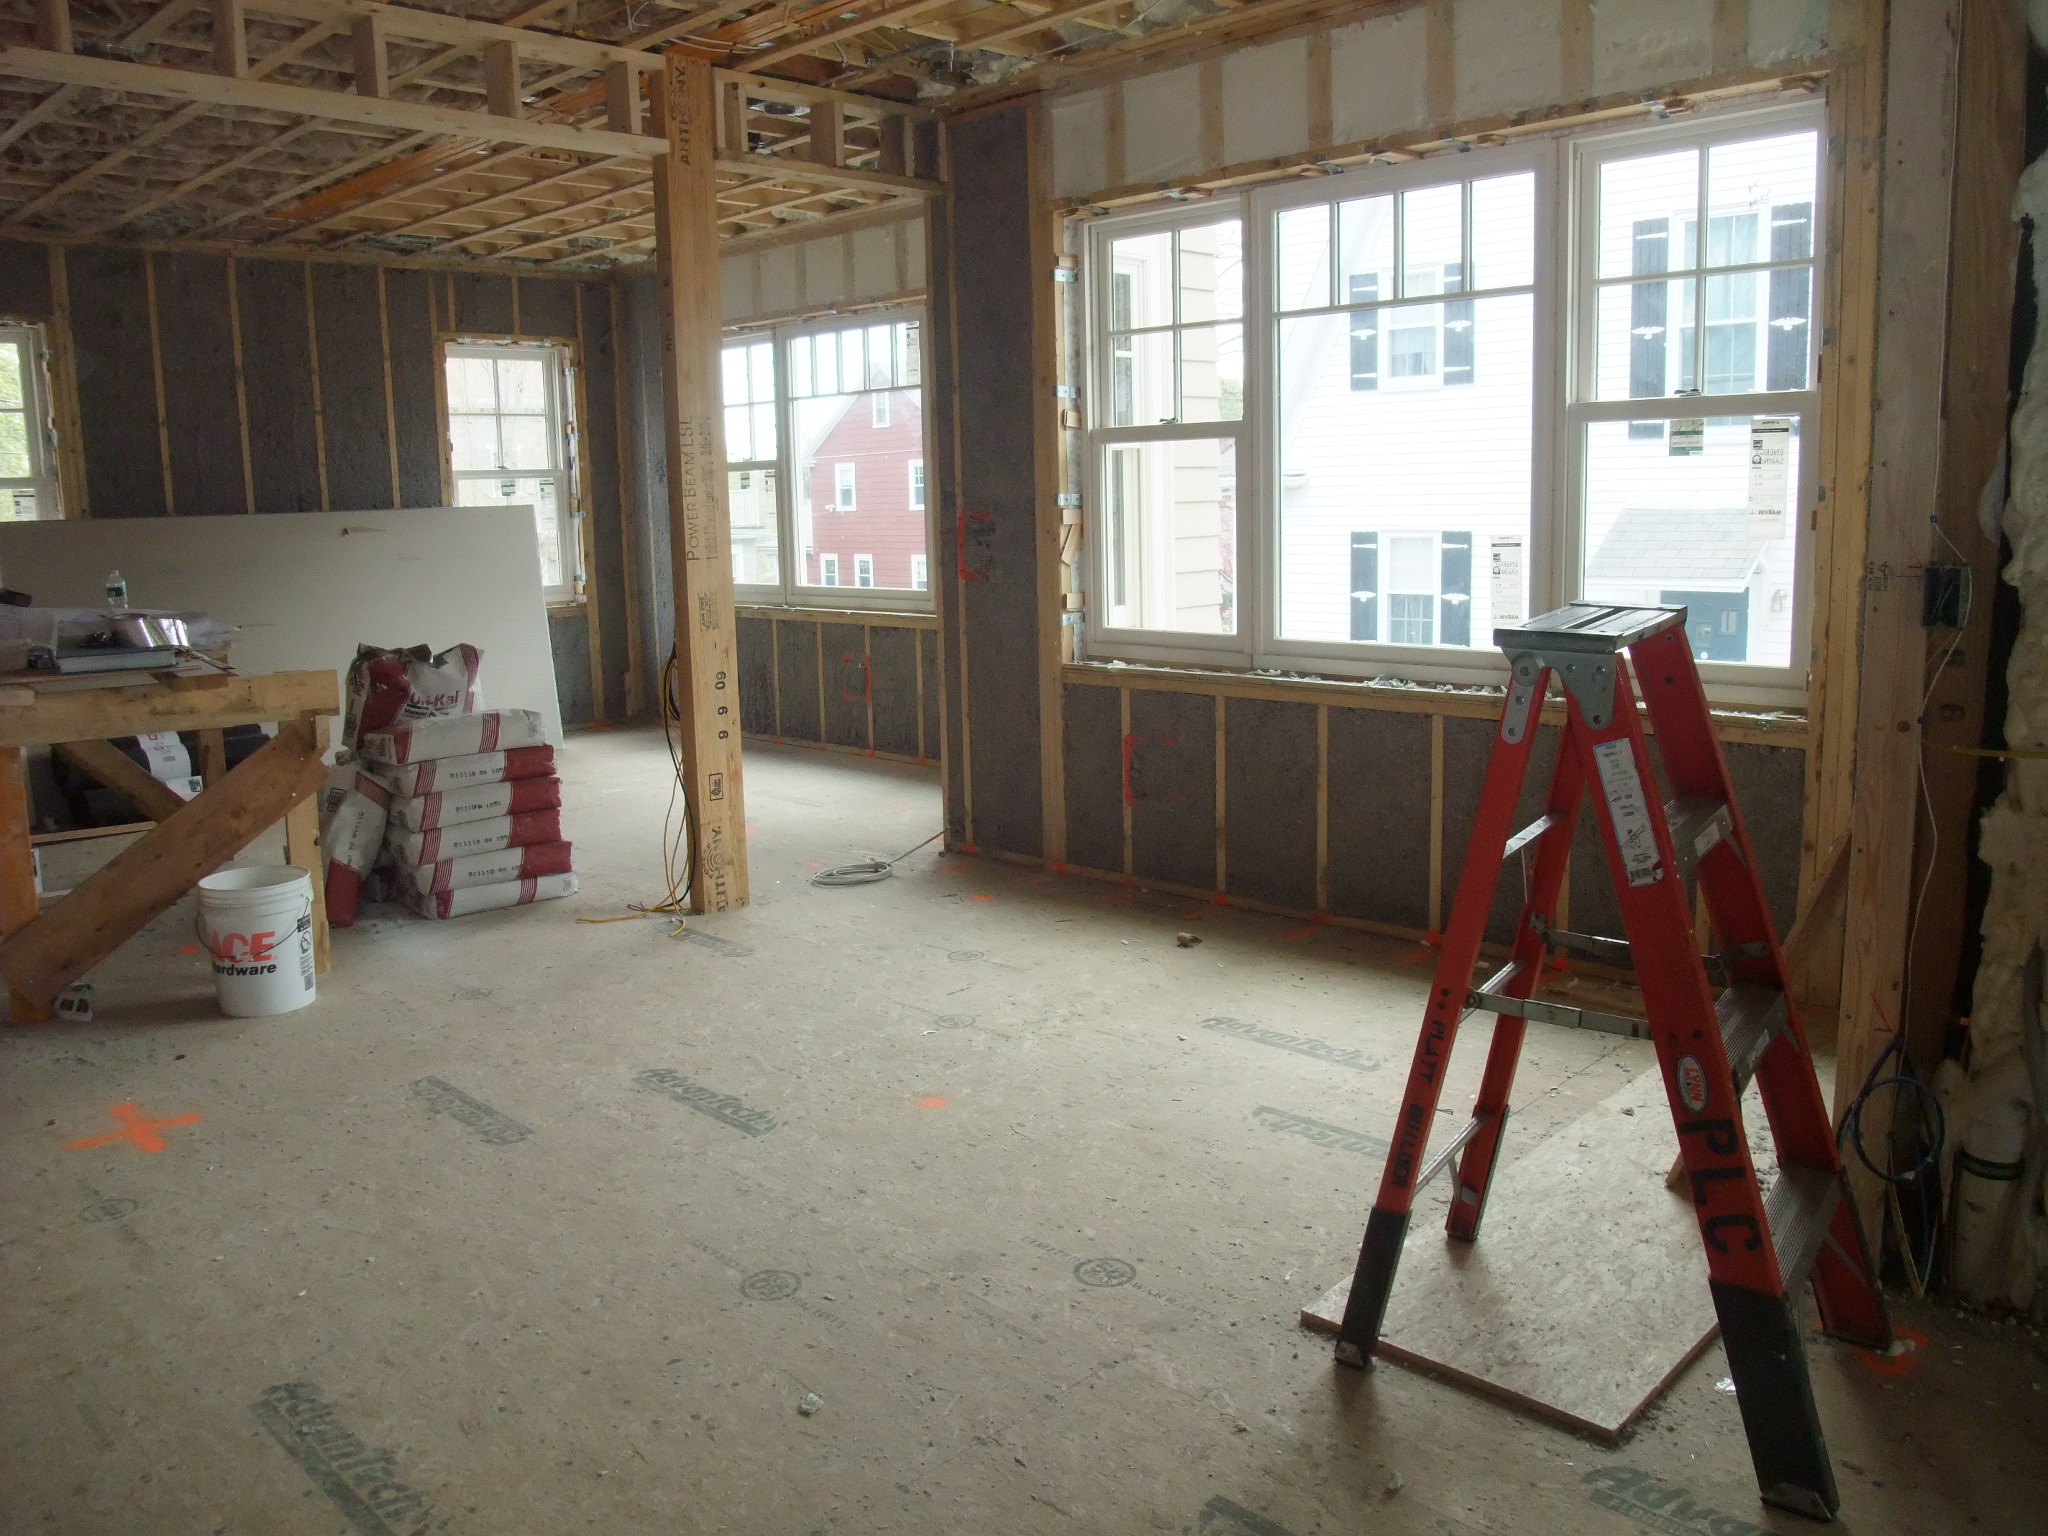
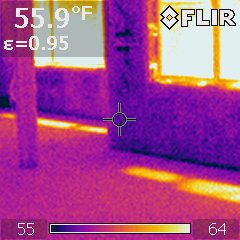
Figure 1: Rough construction with mystery thermal anomalies on the floor
A really shocking example of air leakage is shown in Figure 2: why are there bands of warm brick surfaces in this wintertime shot of this multifamily building? Thermal conduction through steel structure, perhaps?
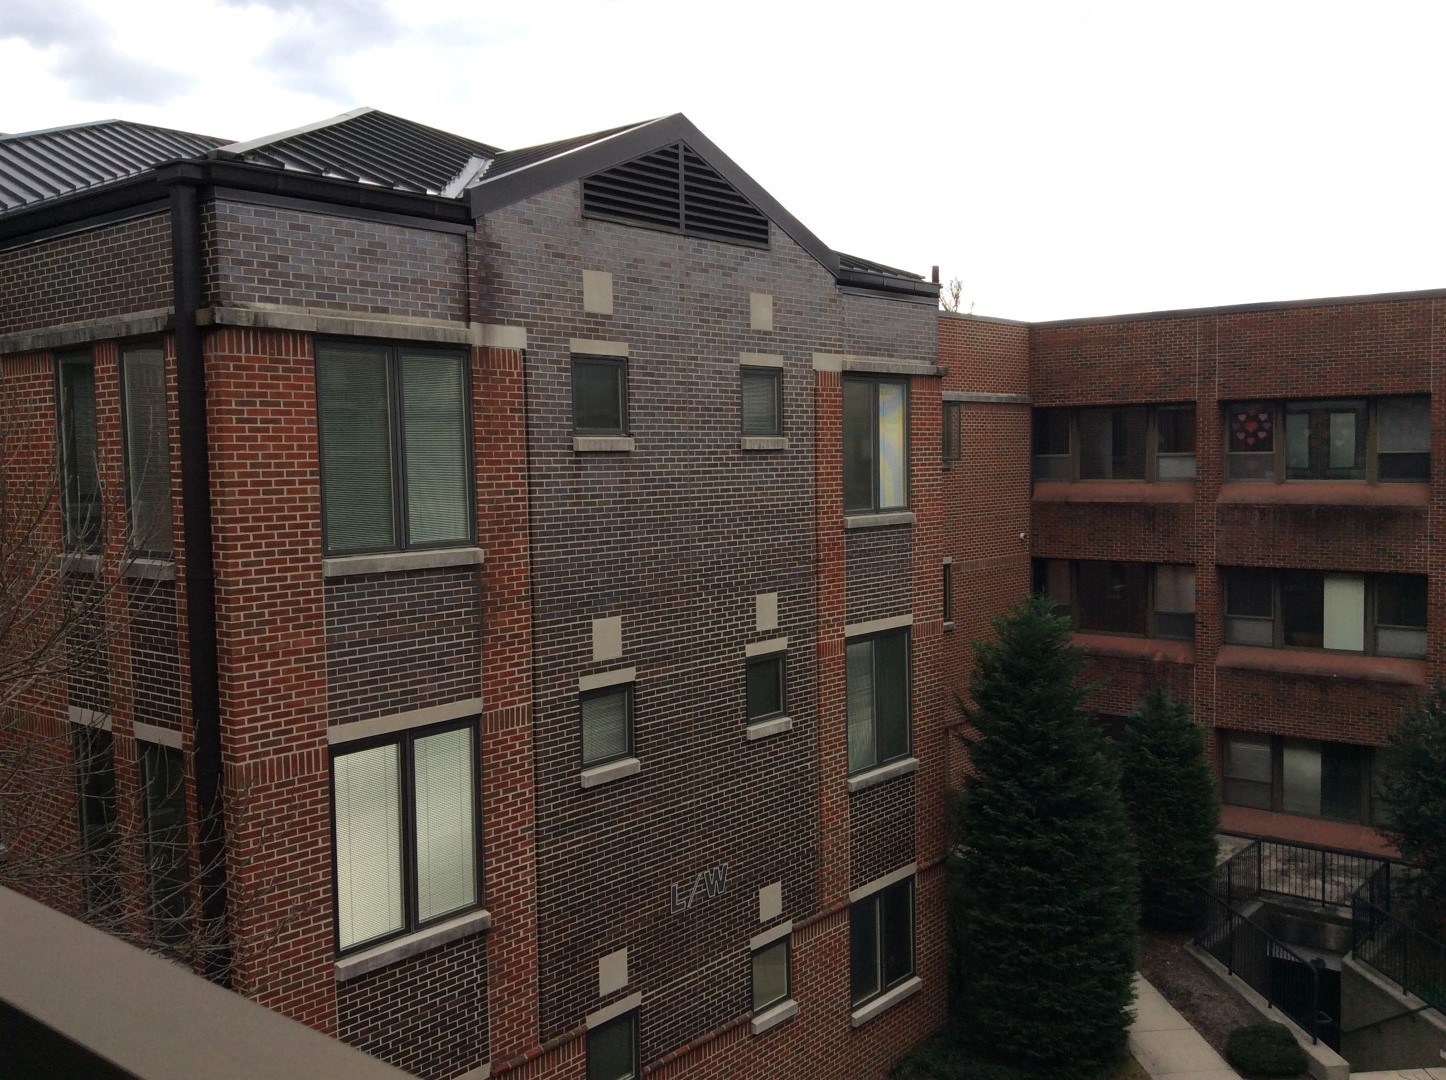
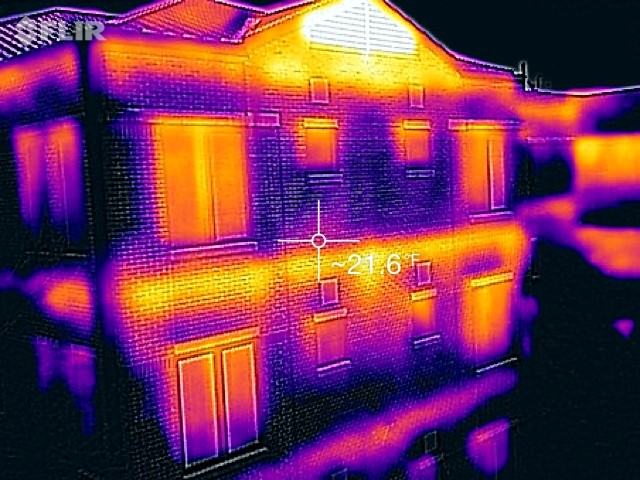
Figure 2: Gross air leakage visible on exterior building enclosure/shell
A look above the suspended ceiling showed a fireproofed steel perimeter beam above the concrete block/CMU and steel stud wall (Figure 3). If you look carefully, you can see a little bit of blue in the gap between the two… yep, that’s blue Dow Styrofoam.
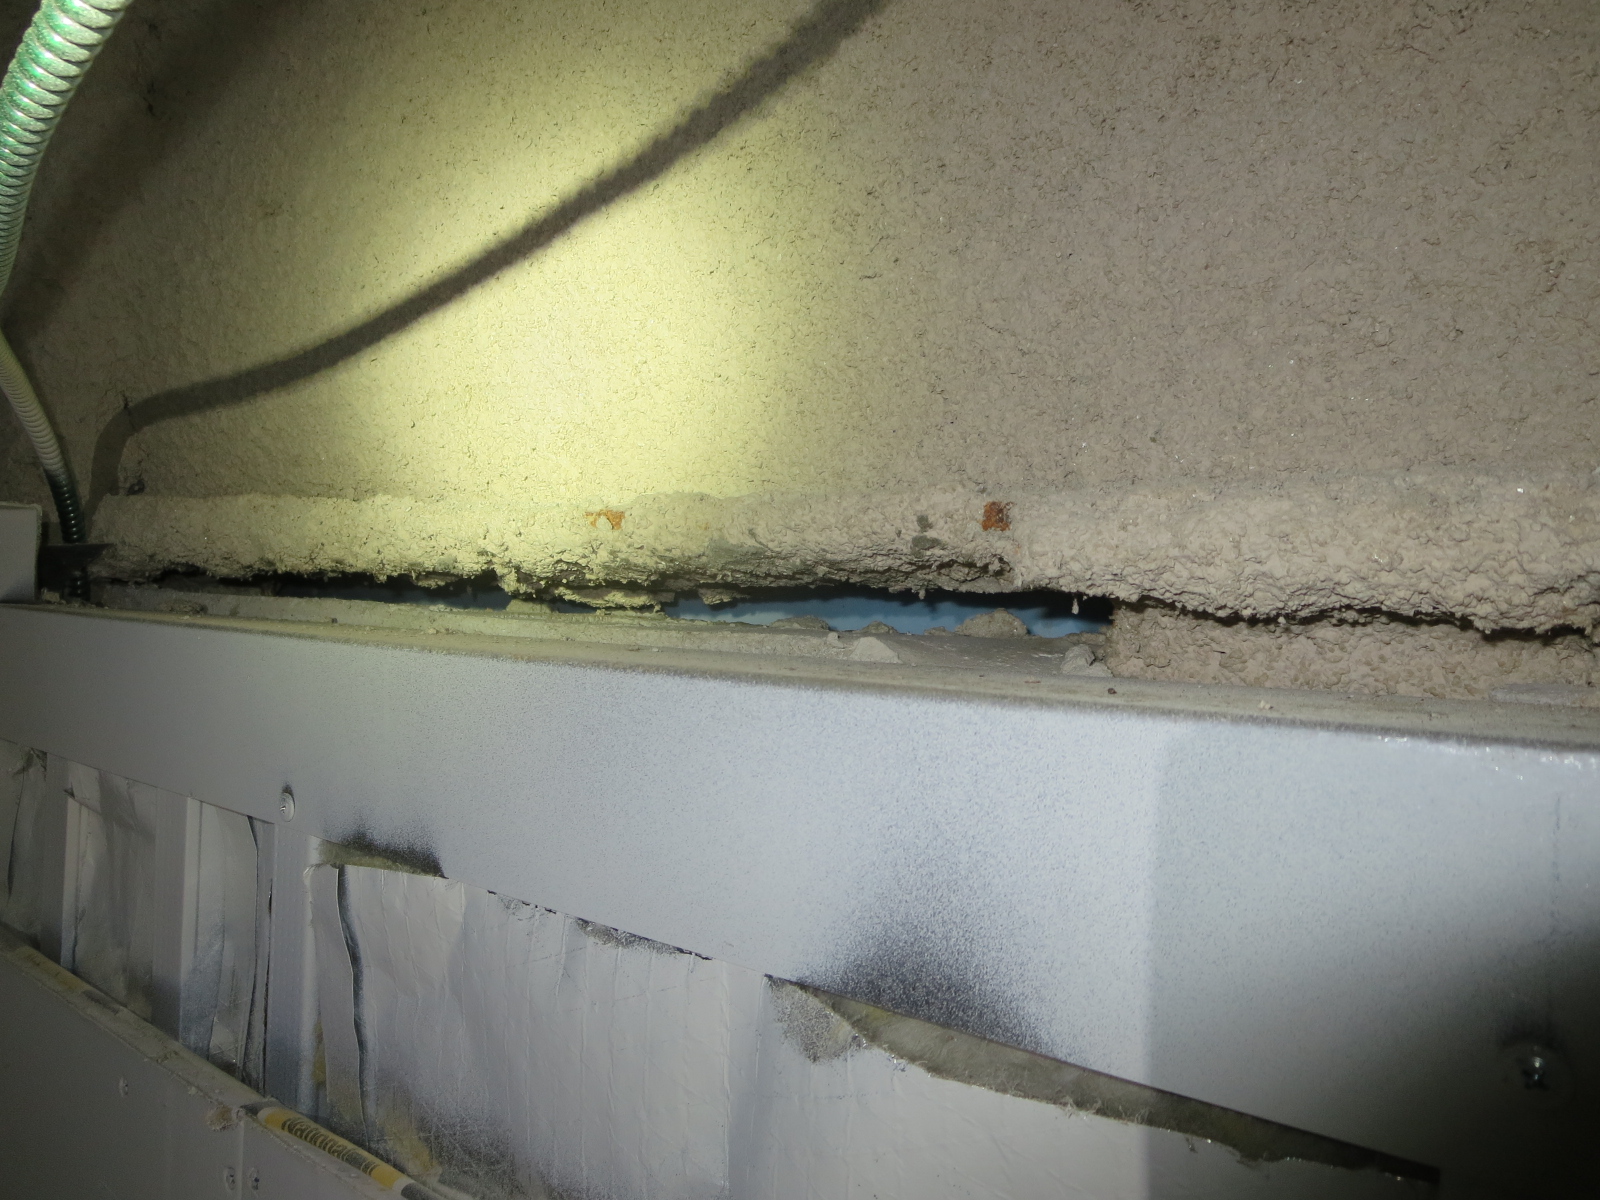
Figure 3: Beam-to-wall interface (above ceiling)
The problem is clearer in the building section (Figure 4): the building has a structural steel frame with infill CMU block and steel stud framing, that stops short of the steel. And there’s no exterior air barrier “wrap” (e.g., adhered membrane) on this building: so outside air (from the brick cavity) is free to get through the foam joints and come in through this half-inch gap around the entire building’s perimeter.

Figure 4: Air leak at gap between beam and wall
The warm air leaks in Figure 2 were worst towards the top of the building, consistent with stack effect, or warm air rising. But the problems were worse than just energy use. During the summer, stack effect reverses, and the lower levels tend to “suck” on the brick cavity. They were pulling in enough outside moist air that they were having condensation and mold problems on their chilled water piping, above the suspended ceiling.
Revealing Water Issues
An infrared camera can also capture water issues: the key is capturing conditions at the right time. Rainfall often cools off surfaces (especially in summer), and evaporation also cools off wet surfaces. In addition, wet surfaces have greater thermal mass, so when the outdoor temperature is rising or falling, their response will “lag behind” the rest of the building.
This is shown at window sills of a masonry building in Figure 5. Windows or glass, unlike most wall claddings, shed almost all of the wind-blown rain that hits them onto the wall below. As a result, window sills are critical for draining this concentrated water away via drip edges, or else you end up with “drool patterns” below the windows, as shown.
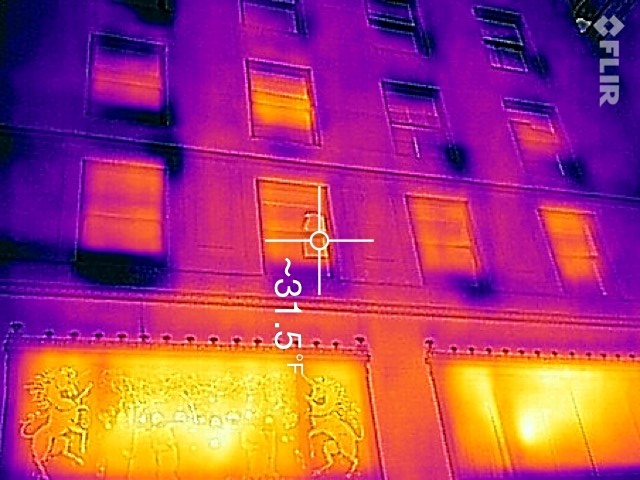
Figure 5: Exterior of masonry building, showing sill water runoff
Thermal bridging through framing can be pretty obvious with an infrared camera if there’s an indoor-outdoor temperature difference. Figure 6 is a wintertime shot of steel studs, which are far more thermally conductive than wood studs. Thermal bridges such as uninsulated slab edges or structural steel embedded in insulated walls would show up in a similar way.

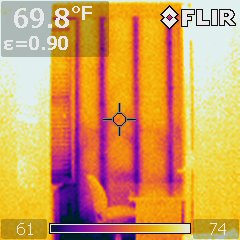
Figure 6: Thermal bridging through steel stud wall construction
One story that’s been passed down is that a homebuilder in Las Vegas once experimented with steel framing during one of the lumber price spikes. They sold the house to a smoker, and the surfaces of the steel studs were cool enough to “plate out” the smoke onto the interior of the walls, resulting in a “telegraphed” line at every steel stud. The builder ended up buying back the house from the owner.
Infrared Cameras and Air
One thing to remember is that an infrared camera does not “see hot or cold air”— the IR camera is looking through the air, and only shows the temperatures of surfaces. So you can see temperatures of what the air is affecting, but not the air itself.
For instance, these floor-mounted heating registers “throw” air up onto the wall very well in Figure 7. As a bonus: this demonstrates the Coandă effect, which is air (or other fluid) following an adjacent flat or curved surface, thus resulting in increased “throw” (check out ACCA Manual T for more).

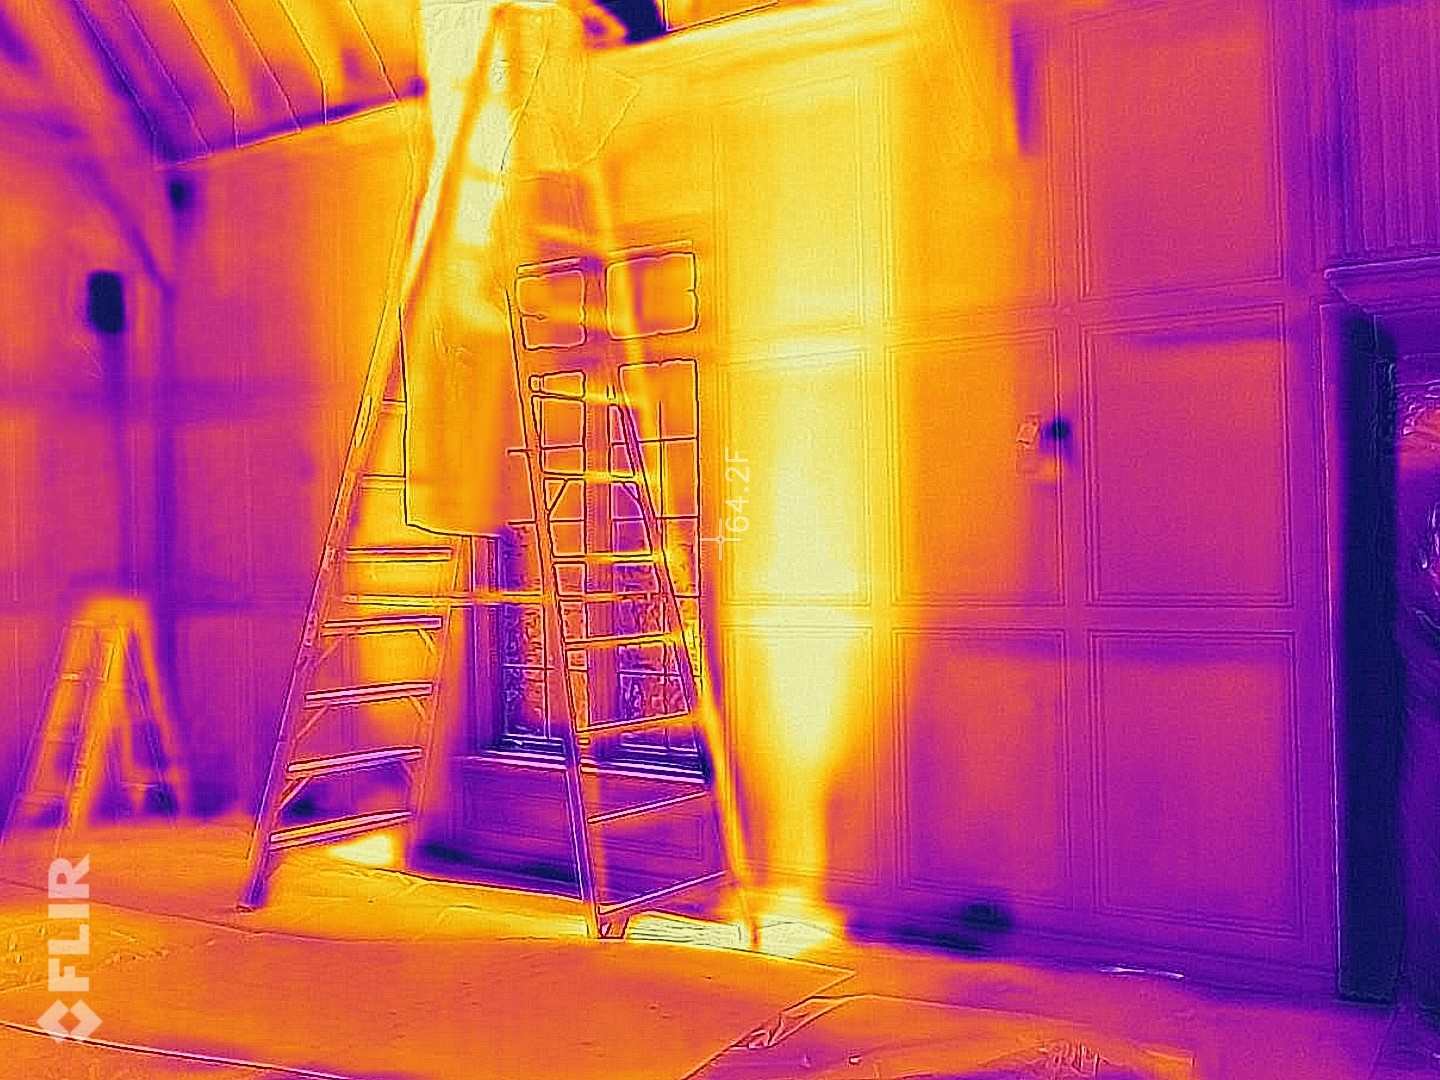
Figure 7: Hot “plumes” from floor registers in heating operation
A problem-solving infrared observation was this wintertime shot inside a house in Figure 8: why is the top of the room glowing? One clue is the ceiling-mounted registers in these first-floor rooms, which are the visible “hot spots” that are also blowing onto the tops of the walls. The problem was that these registers were built for horizontal throw, not vertical, so they ended up “layering” the hot air into the top of the room’s “air sandwich,” resulting in pretty spectacular thermal stratification. There was nothing that “broke up” the hot air at the top of the room, so it stayed there, and left the bottom half cold.
If you have poured black and tans (Guinness on top of Bass ale in a pint glass): the heating system was basically doing the same thing, gently pouring out a layer of hot air on the top of the first floor’s “air sandwich,” without churning things up.
The problem at this house was even worse than discomfort: with this stratification, the thermostat was typically below the hot-cold boundary line. So the heating system ran for hours until the hot layer got deep enough to affect the thermostat… the system would shut off… then the cycle would repeat. But of course, the second floor was sweltering the entire time.
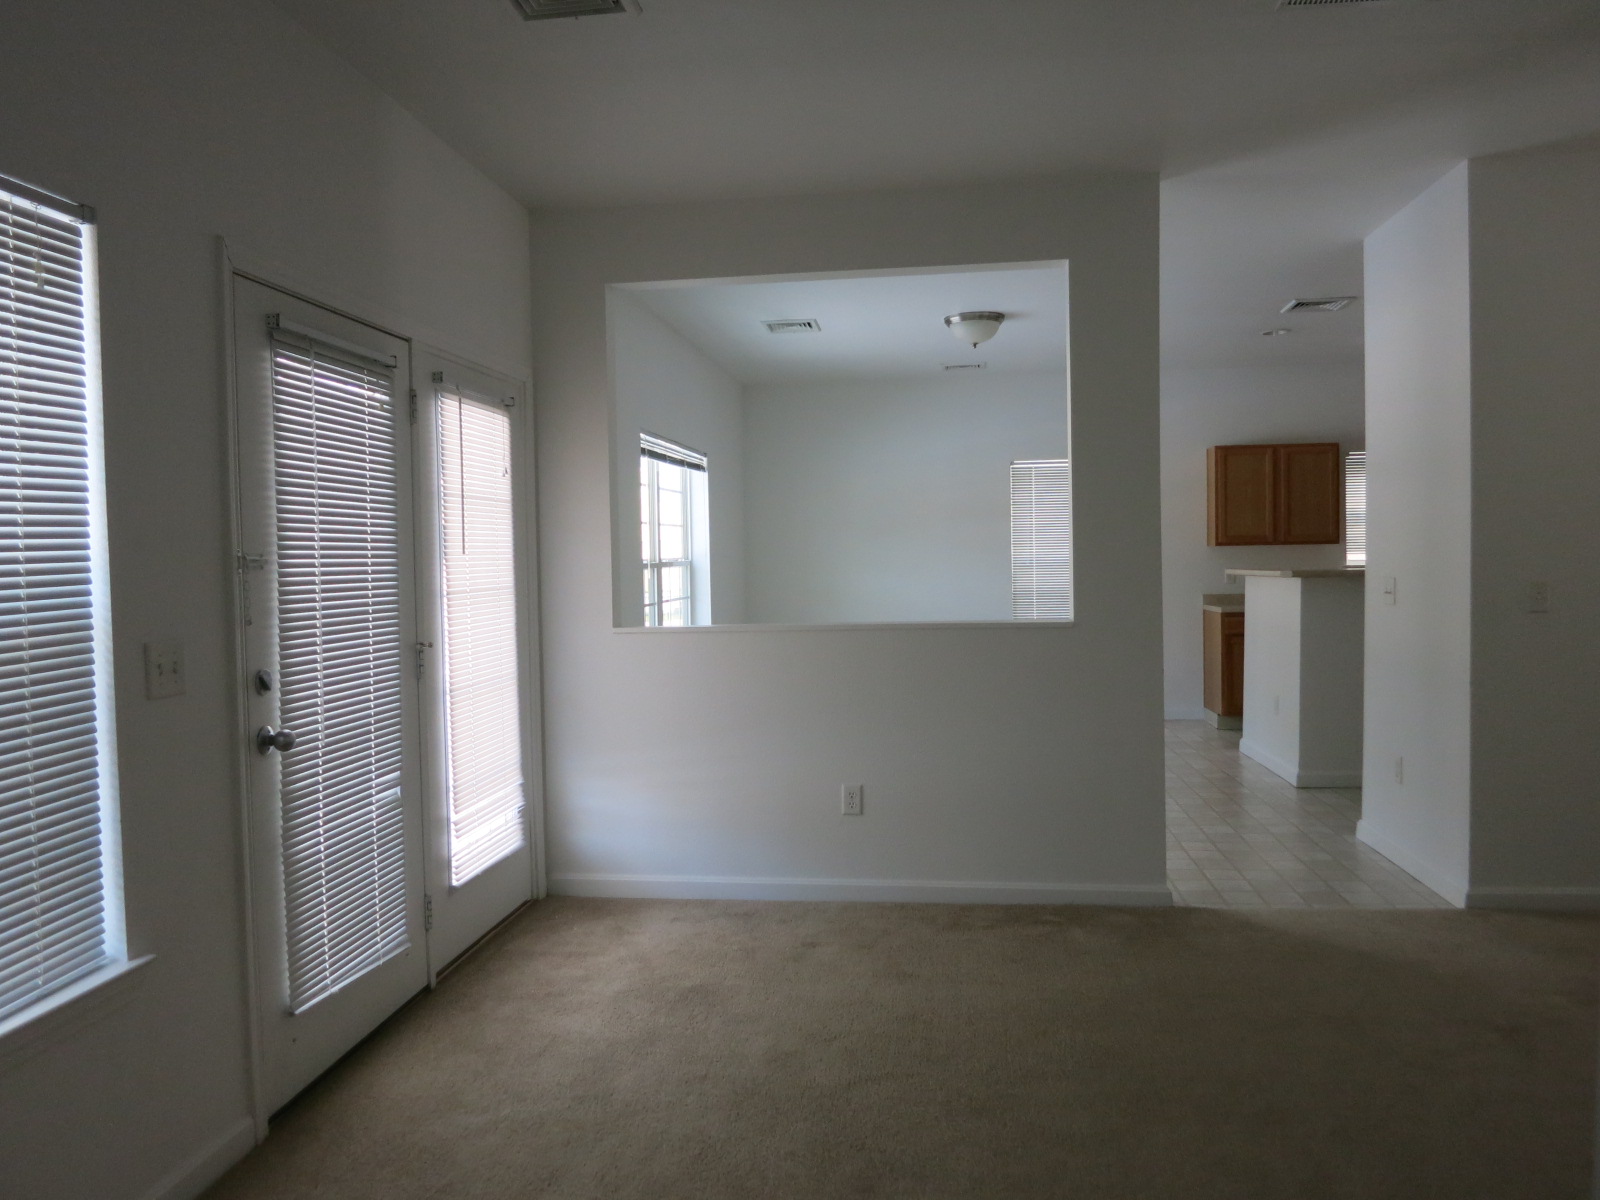
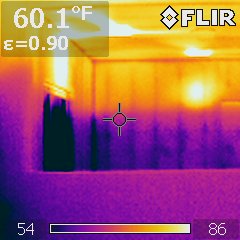
Figure 8: Thermal stratification from poor ceiling register distribution
One last trick for visualizing airflows is something that I owe to Robb Aldrich at Steven Winter and Associates. If you want to visualize how an HVAC system “throws” air—for instance, a mini-split—put up a piece of cardboard that cuts a cross section of the “air plume,” and it shows up beautifully in infrared (see pics: https://www.swinter.com/party-walls/air-source-heat-pumps-cold-climates-part-ii/).
Air + Heat (Enclosure Depressurization and Infrared)
A combination that many of you are probably familiar with is fan pressurization or depressurization plus an infrared camera to sleuth out building air leakage—we are combining the topics of air and heat here. This powerful technique relies on an indoor-outdoor temperature difference to visualize leakage.
We have the choice of pressurizing or depressurizing the building.
Pressurization (forcing air into the building, Figure 9) results in “induced exfiltration” or outward leakage of interior air; the leak would be visible on the outside of the building. However, these air leakage thermal anomalies are often overwhelmed by outdoor surface temperatures, especially during the day, when the building is sunlit.
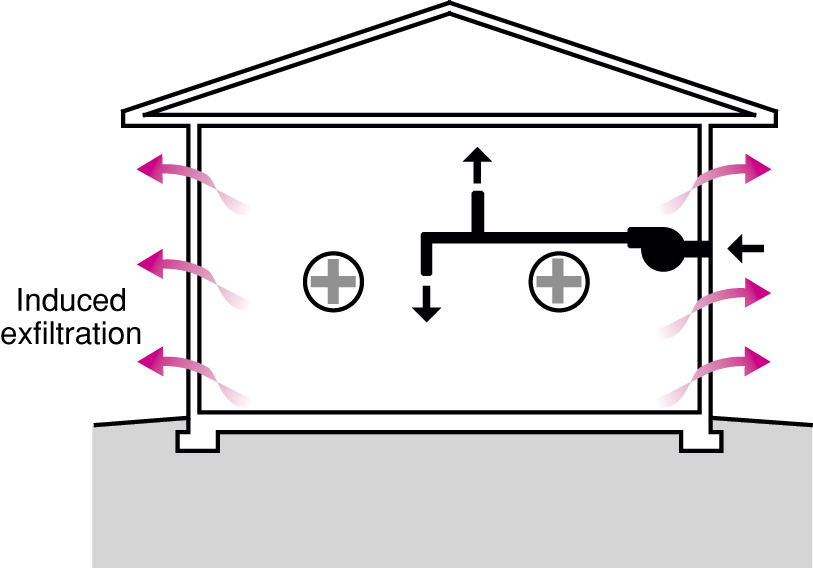
Figure 9: Building pressurization (causes induced exfiltration of interior air)
Depressurization (pulling air out of the building, Figure 10) results in “induced infiltration” or inward leakage of exterior air; the leak would be visible on the inside of the building. This is my typical go-to technique. I recommend walking around the building with an infrared camera first, to find any existing thermal anomalies (such as thermal bridges). Then, I would depressurize (turn on the blower door fan), and do another walk of the building, to see what has changed.
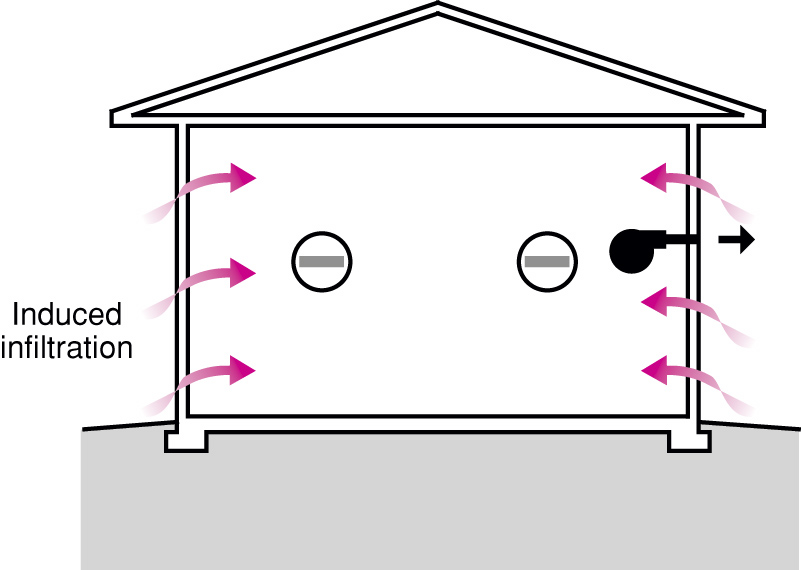
Figure 10: Building depressurization (causes induced infiltration of exterior air)
One characteristic of air leaks is they often appear as “plumes” or “jets” of air, as shown at a leaky door threshold weatherstrip in Figure 11. Once again, this shows up on the surfaces being hit by that cold outside air (induced infiltration).
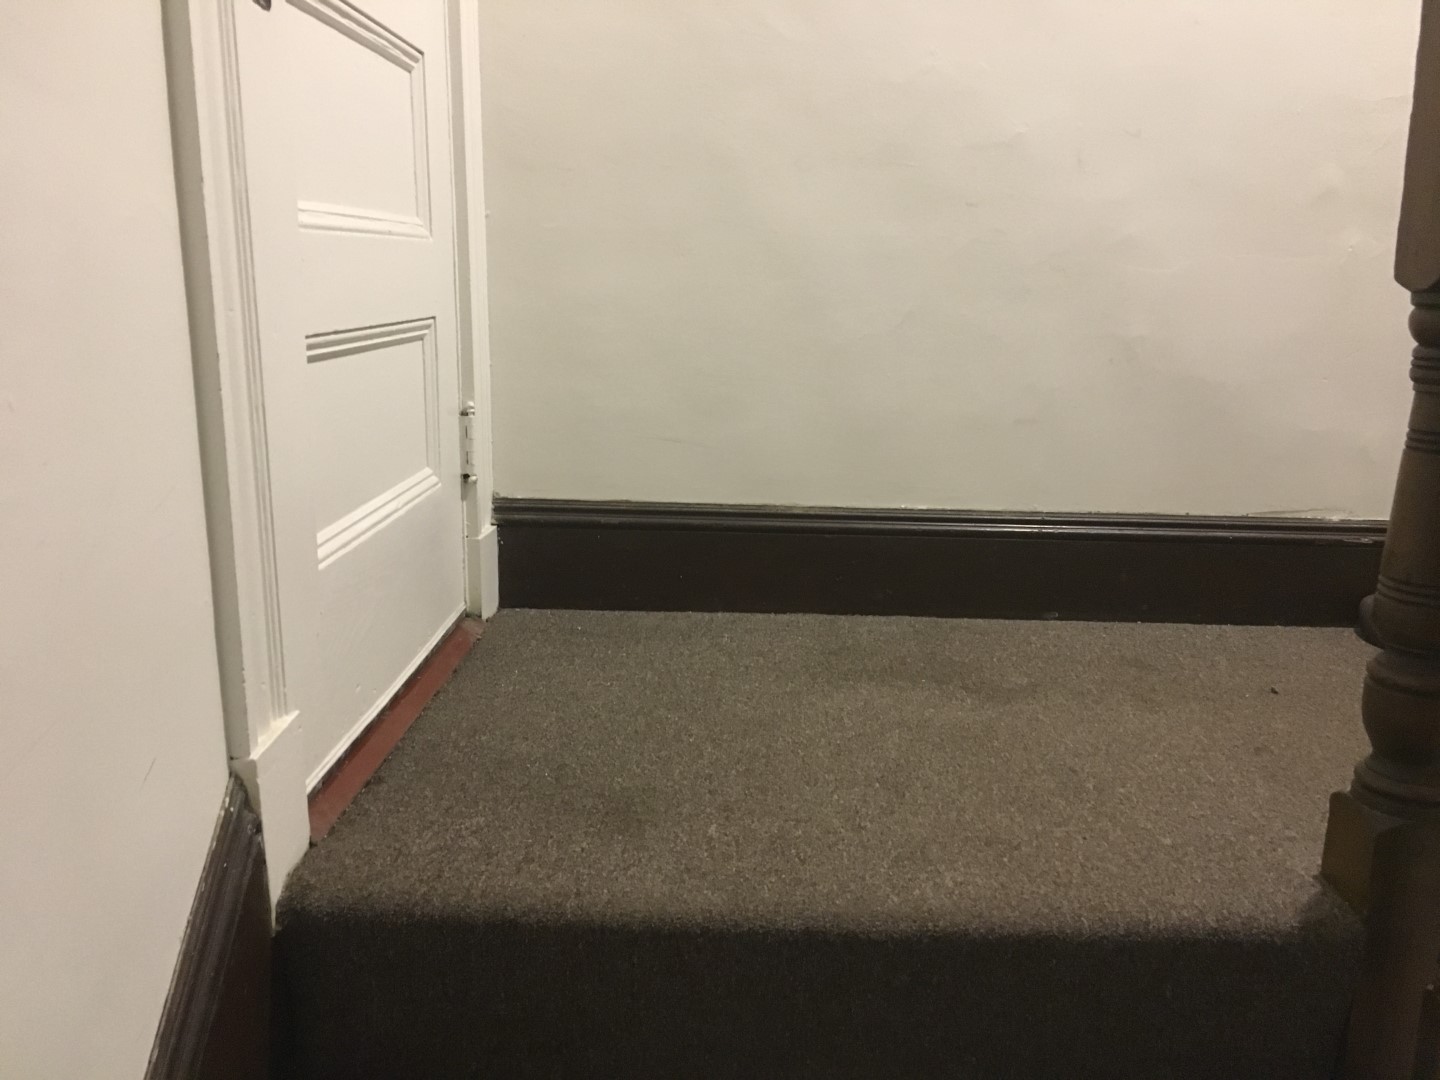
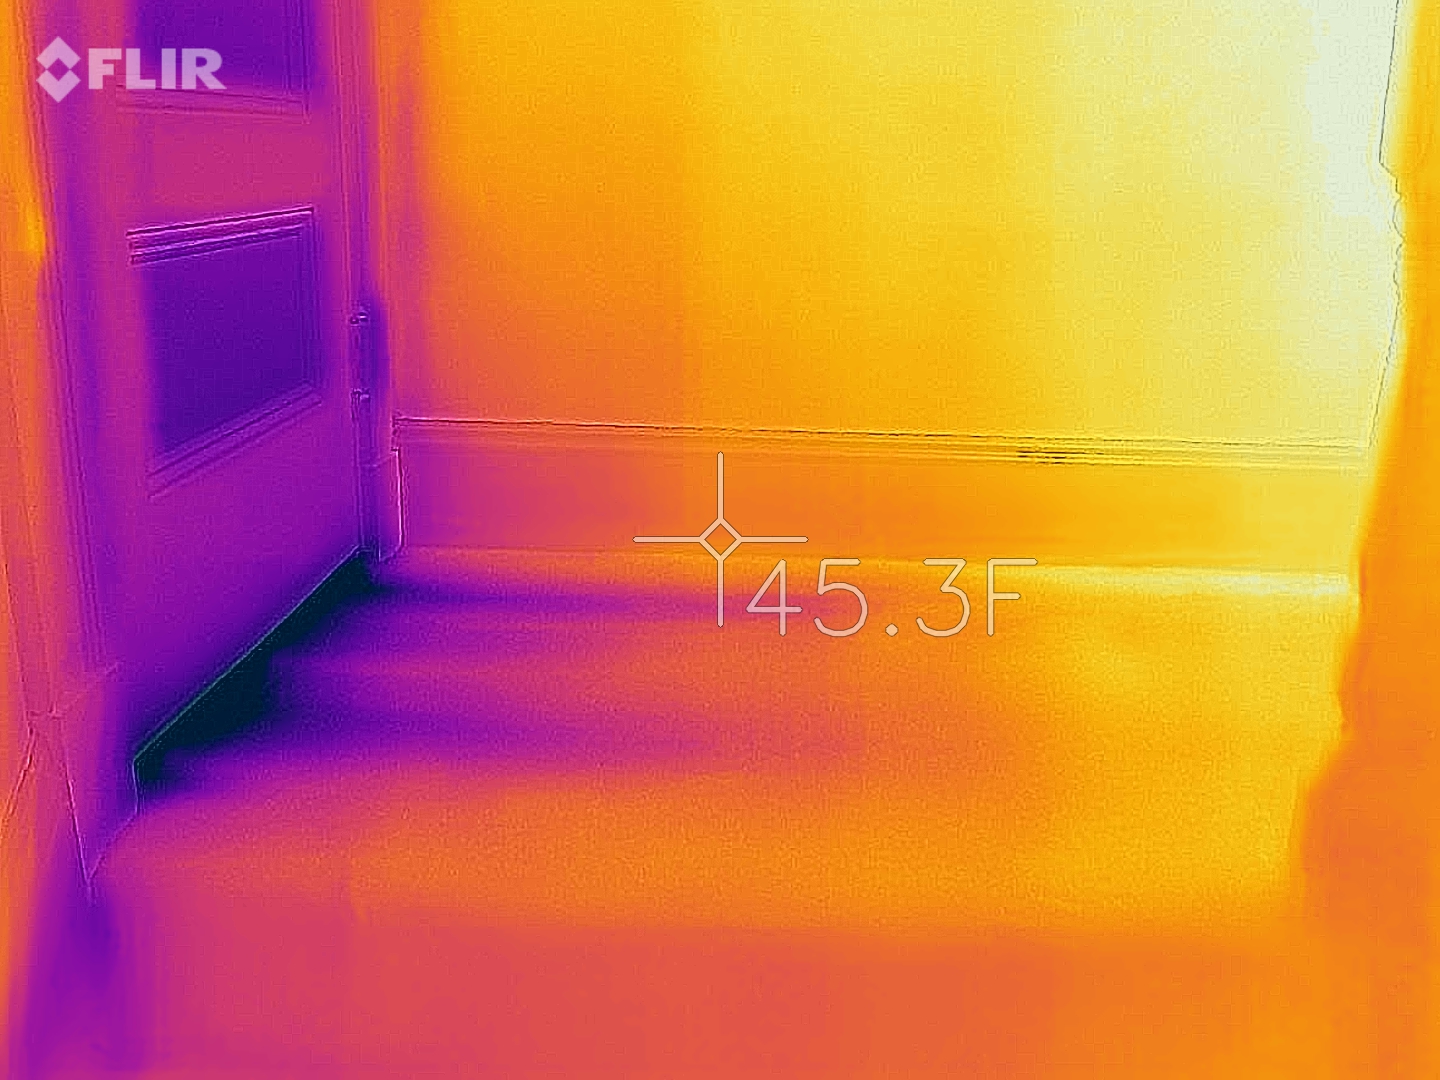
Figure 11: Induced infiltration air leakage “plumes” at a door sill gasket (winter)
Tongue and groove ceilings are a classic problem when they run from indoors to outdoors at the gable end or roof rake: depressurization in wintertime shows air jetting in at every board joint (Figure 12).
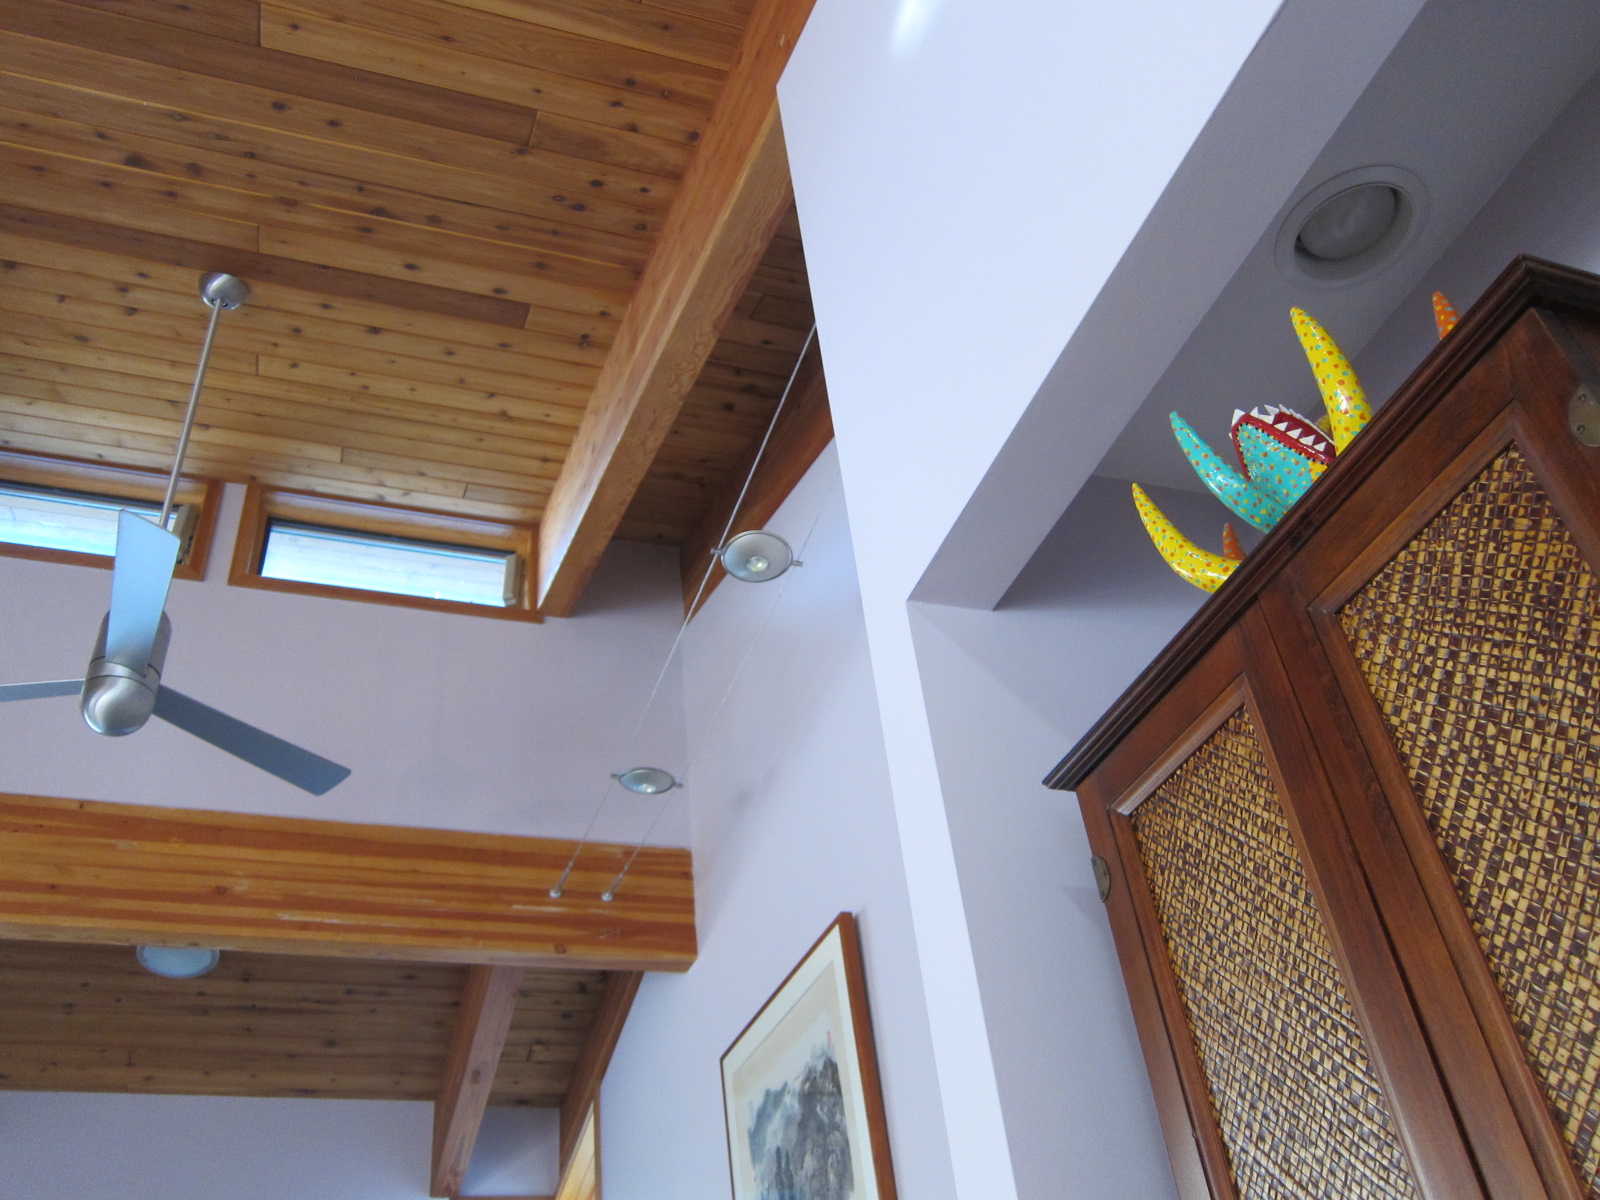
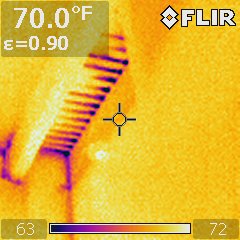
Figure 12: Air leakage at tongue and groove roof/ceiling that extends indoors/outdoors (winter)
This technique can also be used to find air leakage hidden behind interior finishes. Figure 13 shows a vented cathedral ceiling during summertime depressurization: hot outside air is leaking in at the roof ridge vents, through fiberglass insulation, and is getting pulled inside via the recessed lights and other ceiling plane air leaks.
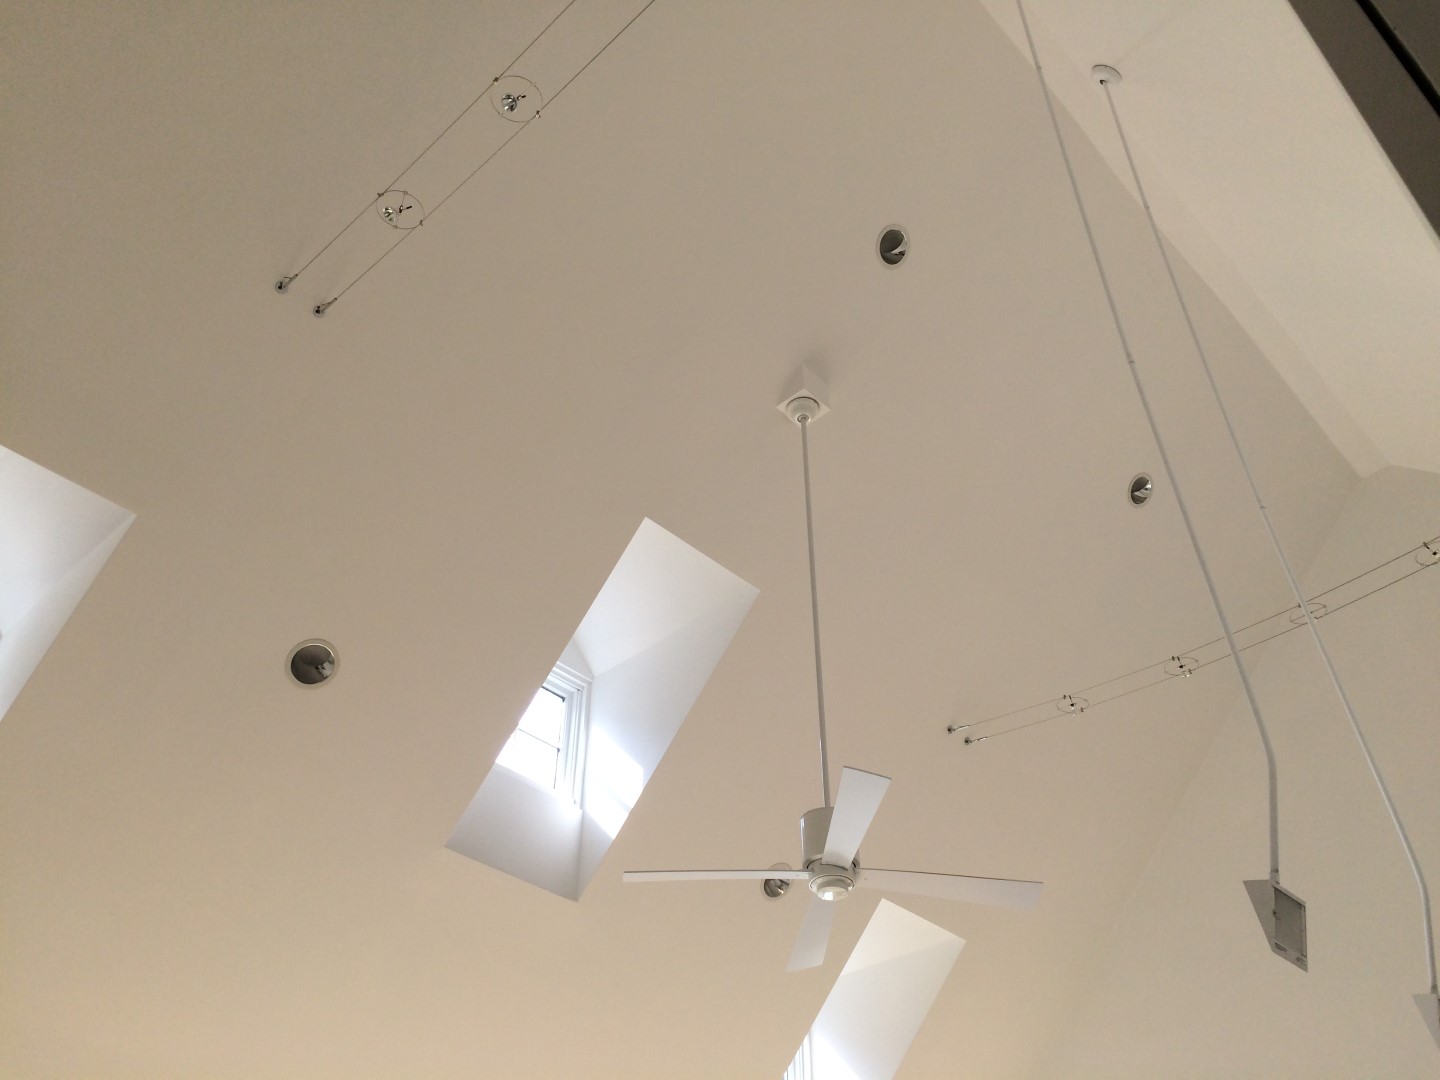
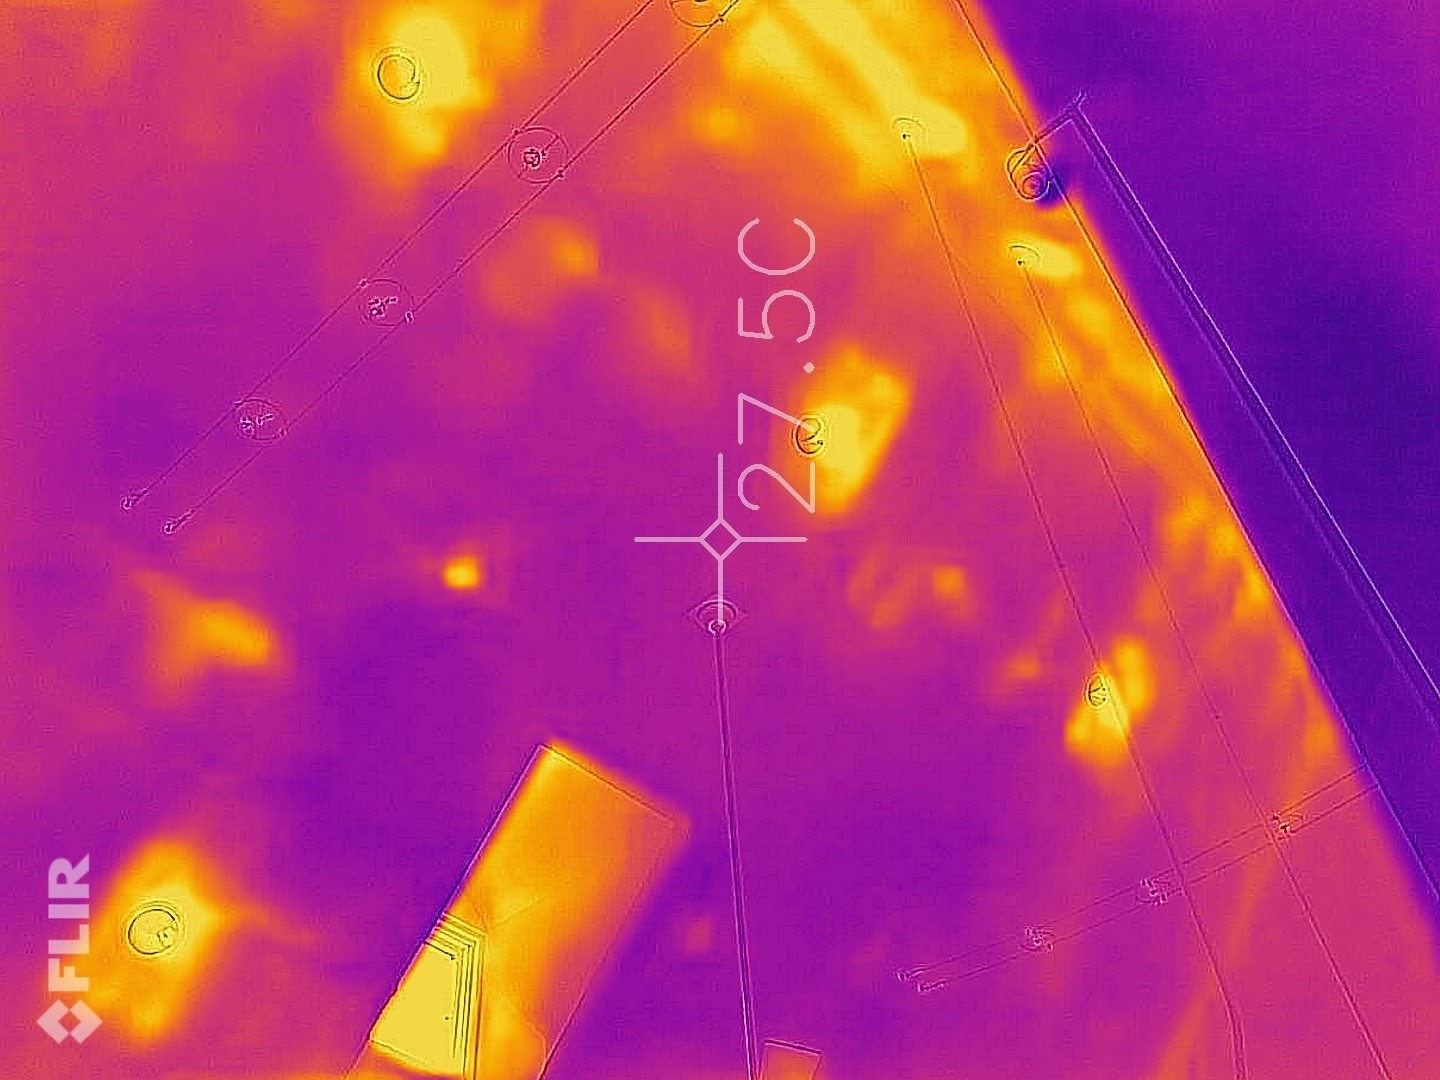
Figure 13: Induced infiltration at cathedral ceiling; note ridge and recessed lights (summer)
Similarly, Figure 14 shows outside air being pulled from the hot vented attic above the ceiling, down into the interior wall (“wing” wall at the bathroom) and the top plate of the outside wall.
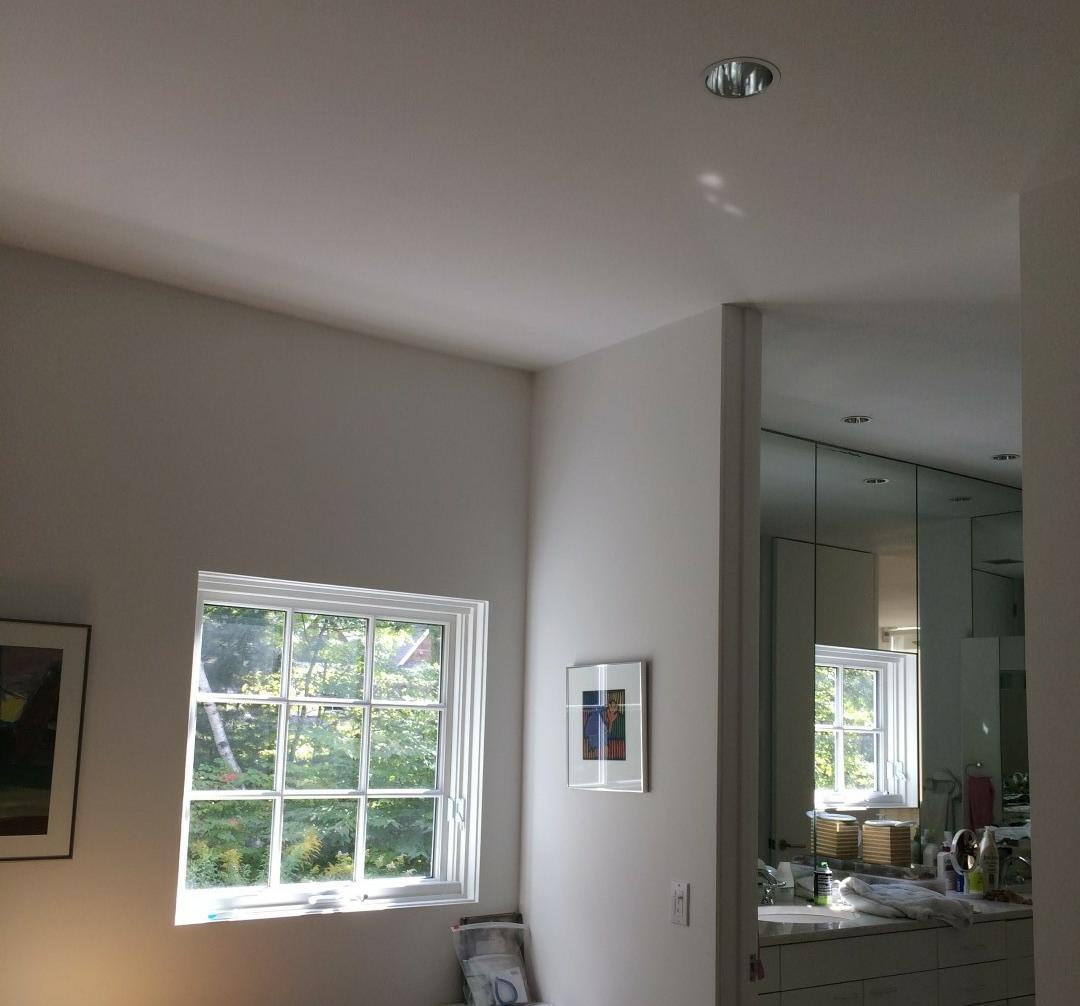

Figure 14: Induced infiltration at vented attic into interior wall and at exterior top plate (summer)
Changing gears, spray foam is often used because of its air-tightening qualities. It provides an excellent air barrier where it is present and continuous. However, at discontinuities where it is not present, it does nothing to stop airflow. In other words, spray foam doesn’t air seal when it isn’t there. This commonly occurs in wood frame construction at wood-to-wood joints, such as king/jack/cripple stud joints, corners, top and bottom plates, and rafter connections.
An example of this is shown in Figure 15, which is a “flash and batt” (closed-cell spray foam and fiberglass batt) house being depressurized in wintertime. A huge fan of cold outside air is getting pulled in at the roof-to-wall joint. Pulling back the fiberglass (Figure 16) revealed a row of unsealed wood-to-wood joints at the rafter-to-ceiling joist connection.

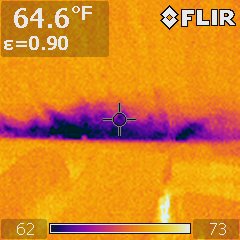
Figure 15: Induced infiltration at spray foam/fiberglass (flash and batt) attic roof-wall connection (winter)
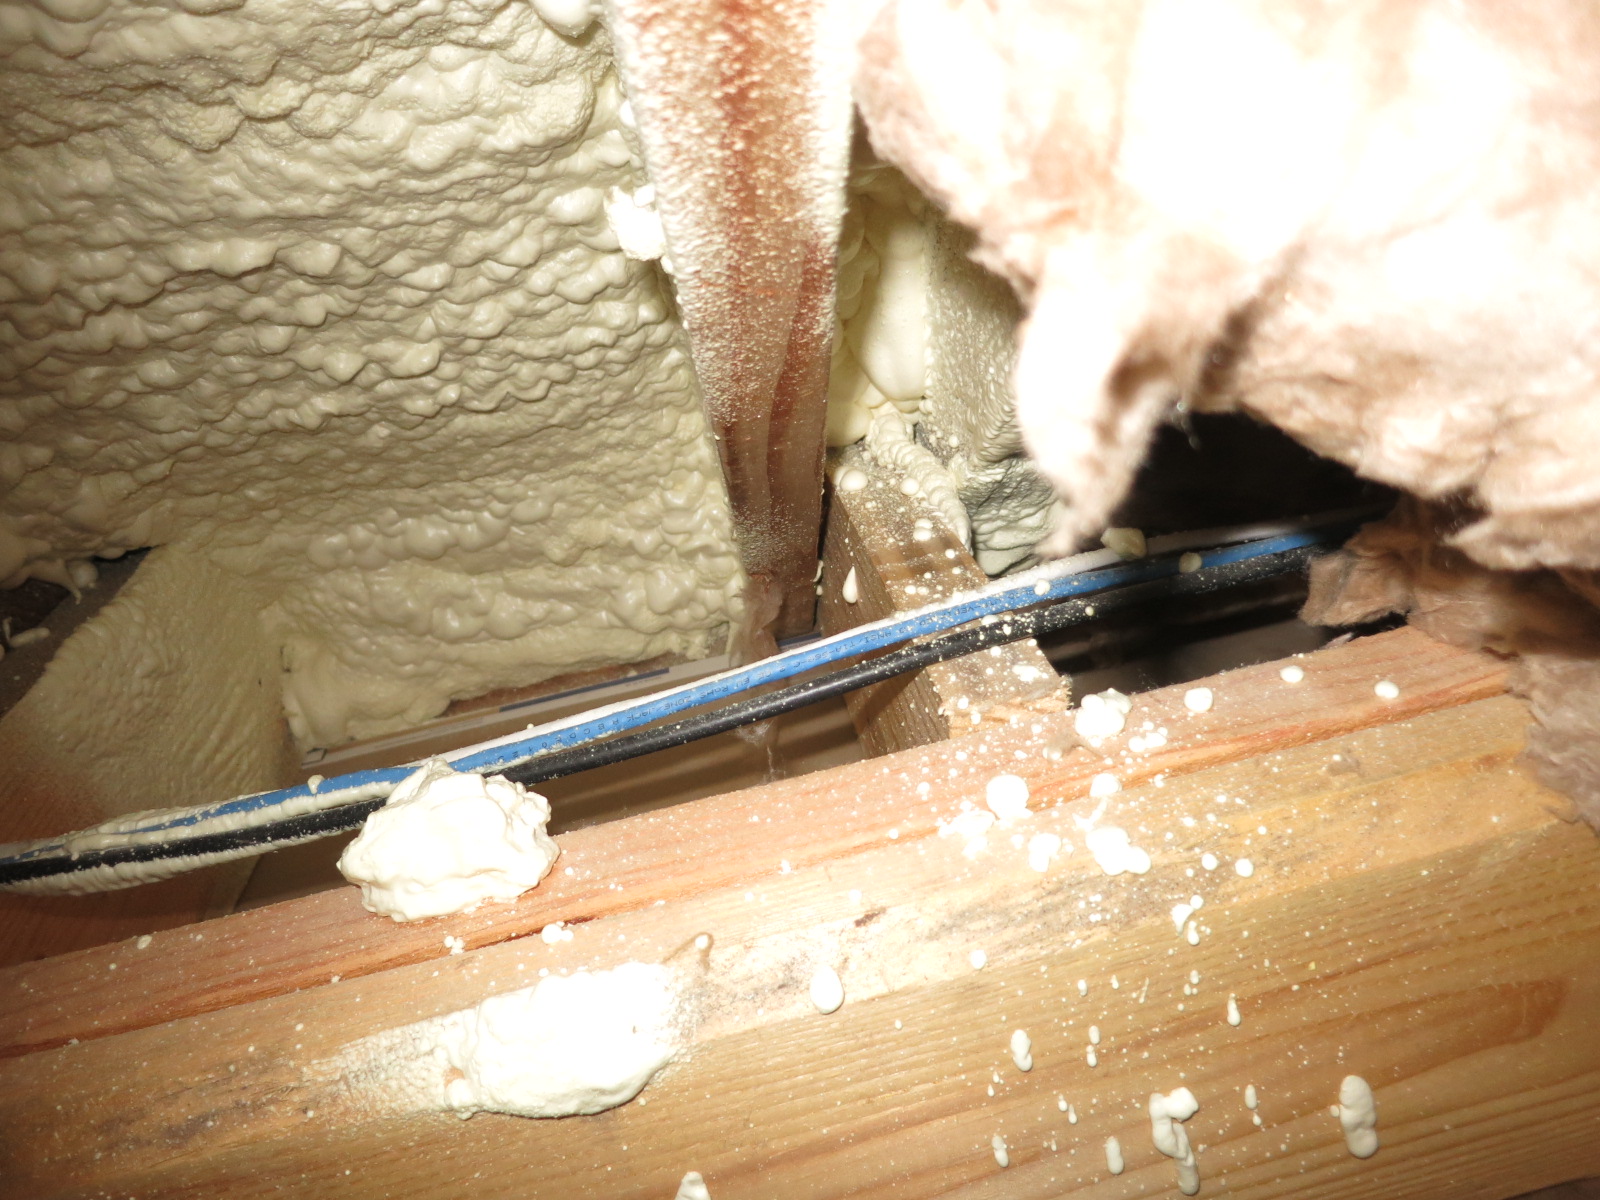
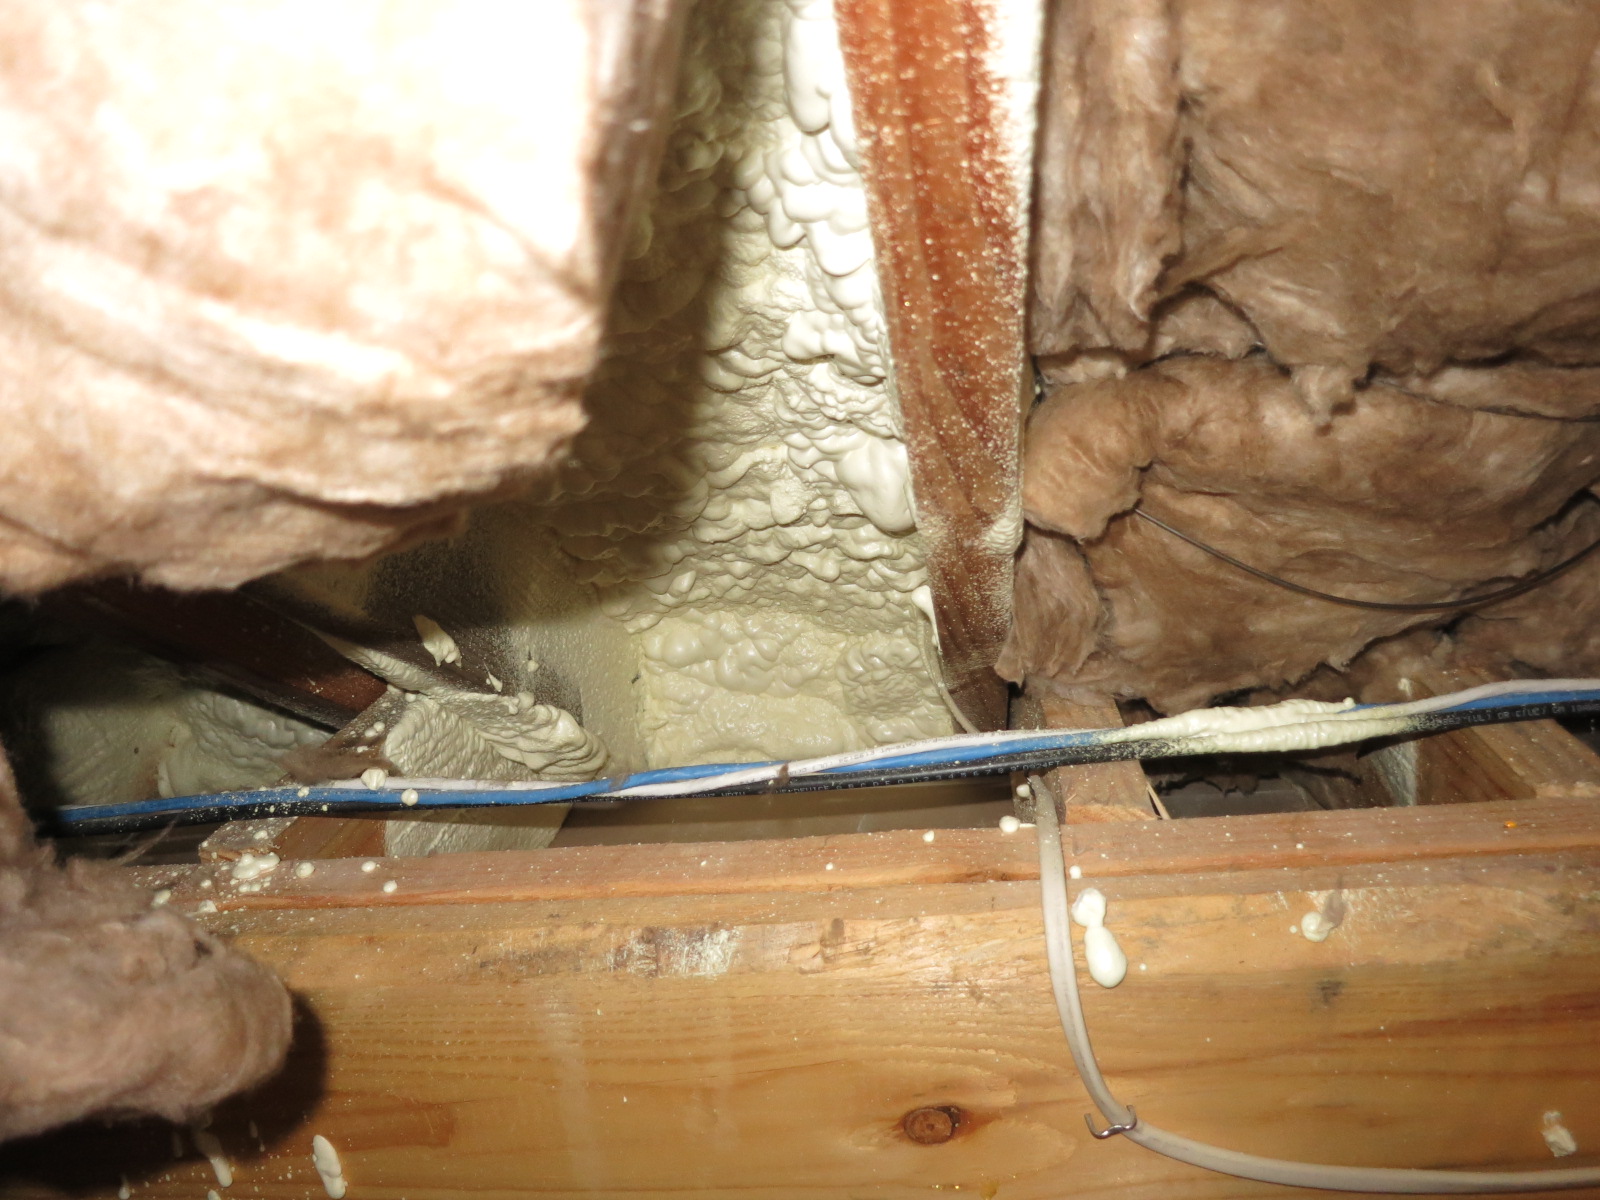
Figure 16: Spray foam imperfections at wood-to-wood joints
Another troublesome detail is windows that are installed using side clips (commonly called masonry straps) and/or window shims. Figure 17 shows a window that was well sealed around its perimeter, except where the shims penetrated through. The recommended detail is to cut the shims off flush, and to run the air sealing detail over the surface.
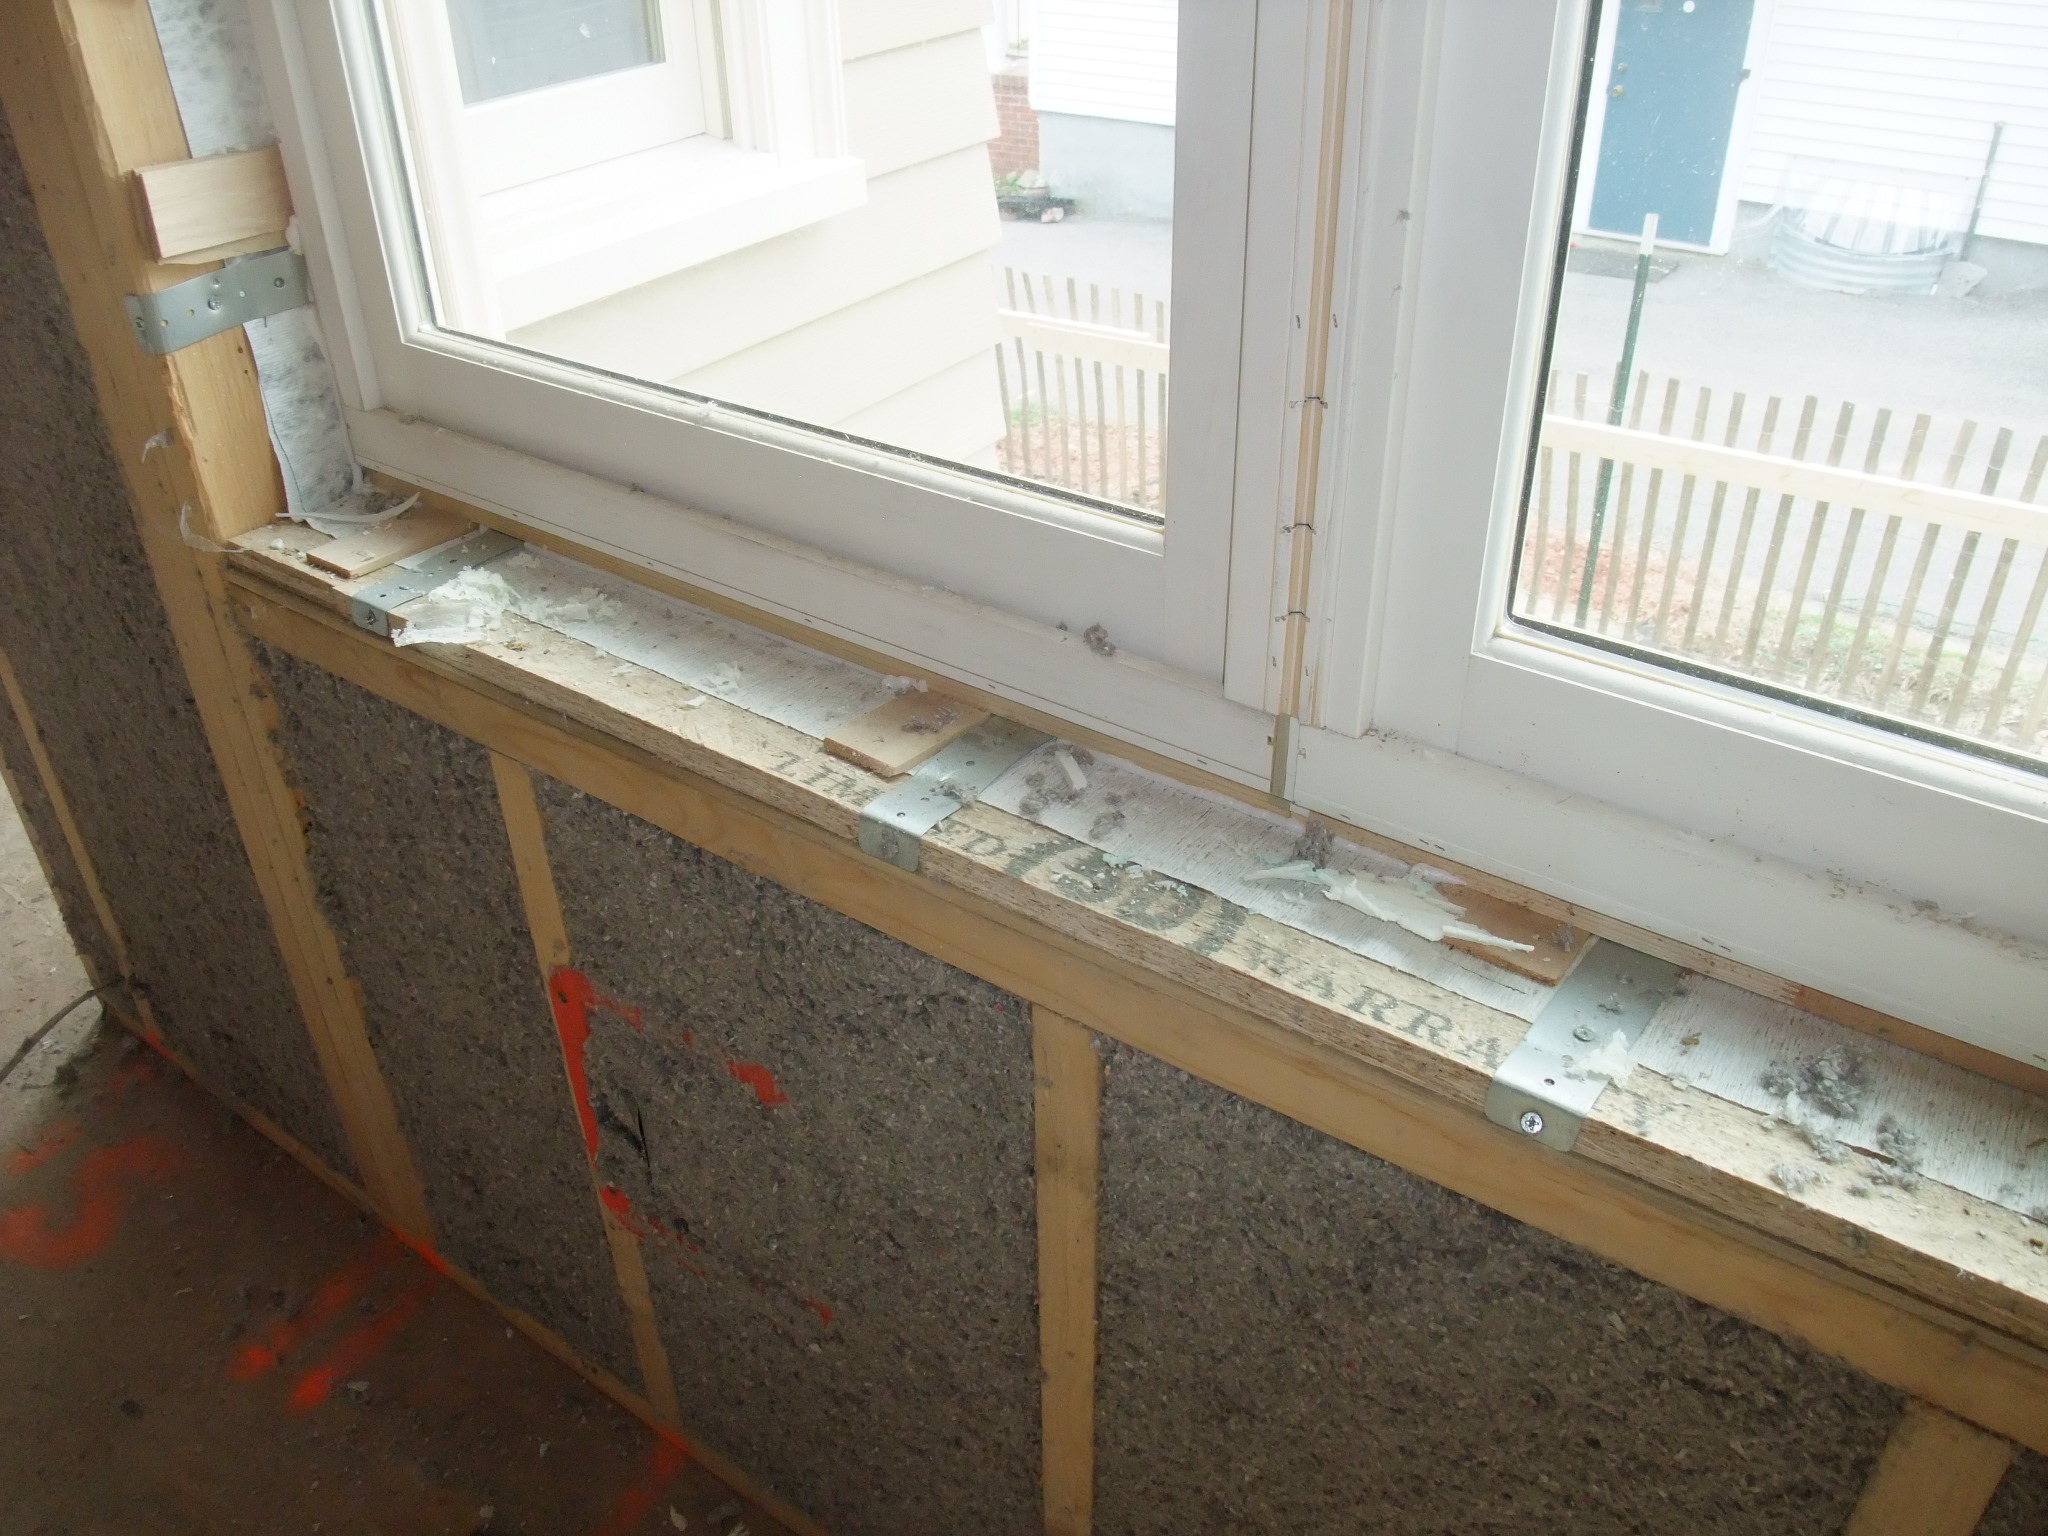
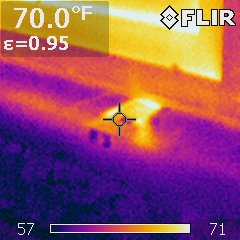
Figure 17: Air leakage around shims at window-to-wall rough opening (summer)
Good solutions to window side clips include using a tape seal covering the entire clip/strap (Figure 18) or embedding the entire clip in the same sealant used around the window perimeter (Figure 19).
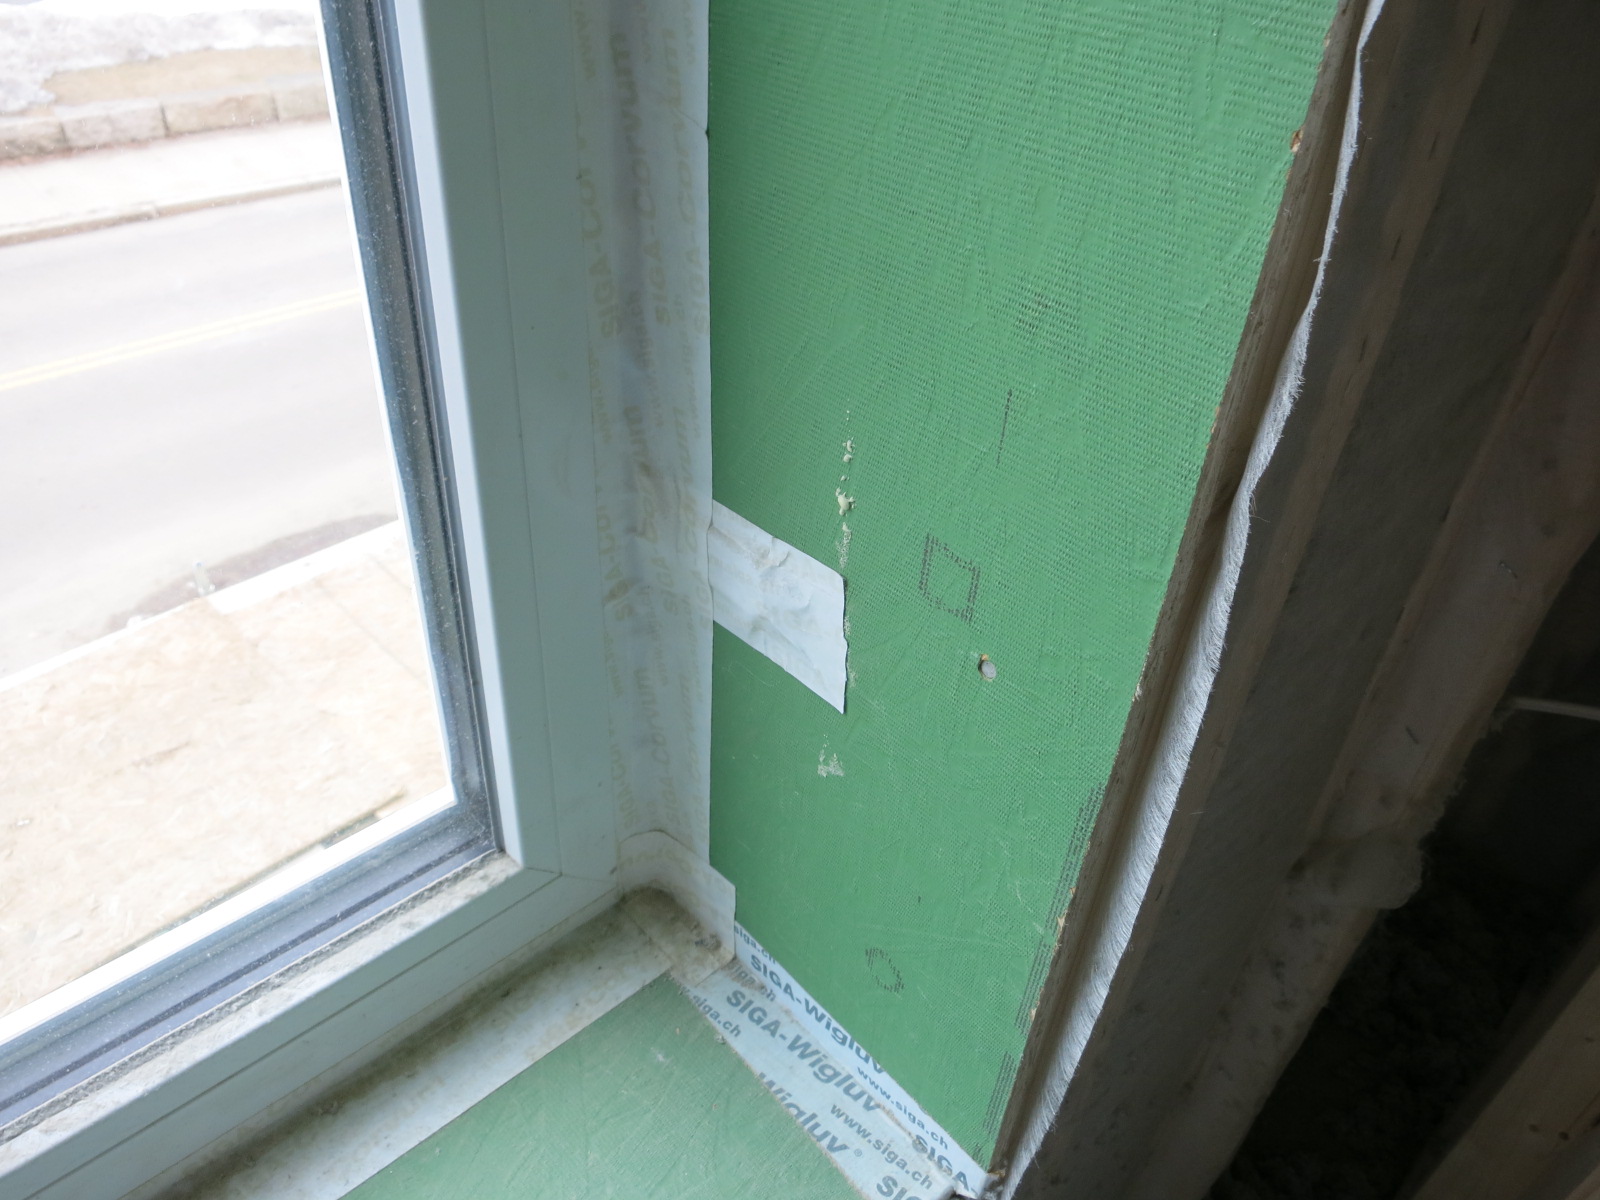
Figure 18: Air sealing window by covering installation clip with tape

Figure 19: Air sealing window by embedding clip in sealant
A Bit About Cameras
I have been using infrared cameras since 2008, so I’m definitely not an old-timer from the days of liquid-nitrogen cannisters and cart-size cameras. I started out using a FLIR b40 (Figure 20), which sold for about $5000 when new, came in an armored Pelican case, and put out 240 x 240 pixel images (“IR resolution: 120 X 120 pixels”). Taking a $5000 instrument to bang around in an attic was never a comfortable feeling. Also, the image was a narrow “soda straw” view: you had to step back to get a good view of the building, and at that point, the image was too blurry (pro tip: use a fixed temperature scale, snap multiple images in a panorama, and stitch them together in photo-editing software).
Nowadays, we can all benefit from advances in technology: I currently carry around a FLIR ONE Pro, which plugs into a smartphone and runs about $400 (Figure 21). It puts out 1440 x 1080 pixel images, overlaying a visual image (showing edges) with the infrared shot. That overlay is a very useful reference: “…right, this shot was in the room with that godawful velvet painting”—that painting would be the same temperature as the wall, and mostly invisible with infrared alone. It also slips into your pocket for trips up to the attic. A better image and a tenth of the price… sometimes, technology advances are grand.
There are many brands and models available; in case anyone asks, I have not tried out the Seek IR camera, so I can’t offer any comparisons.
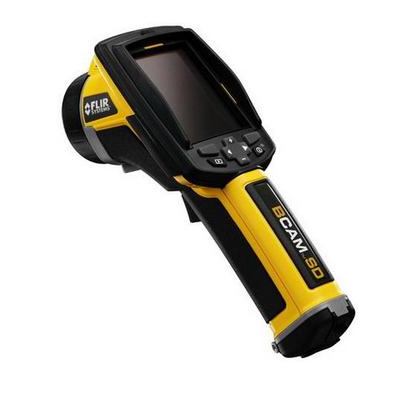
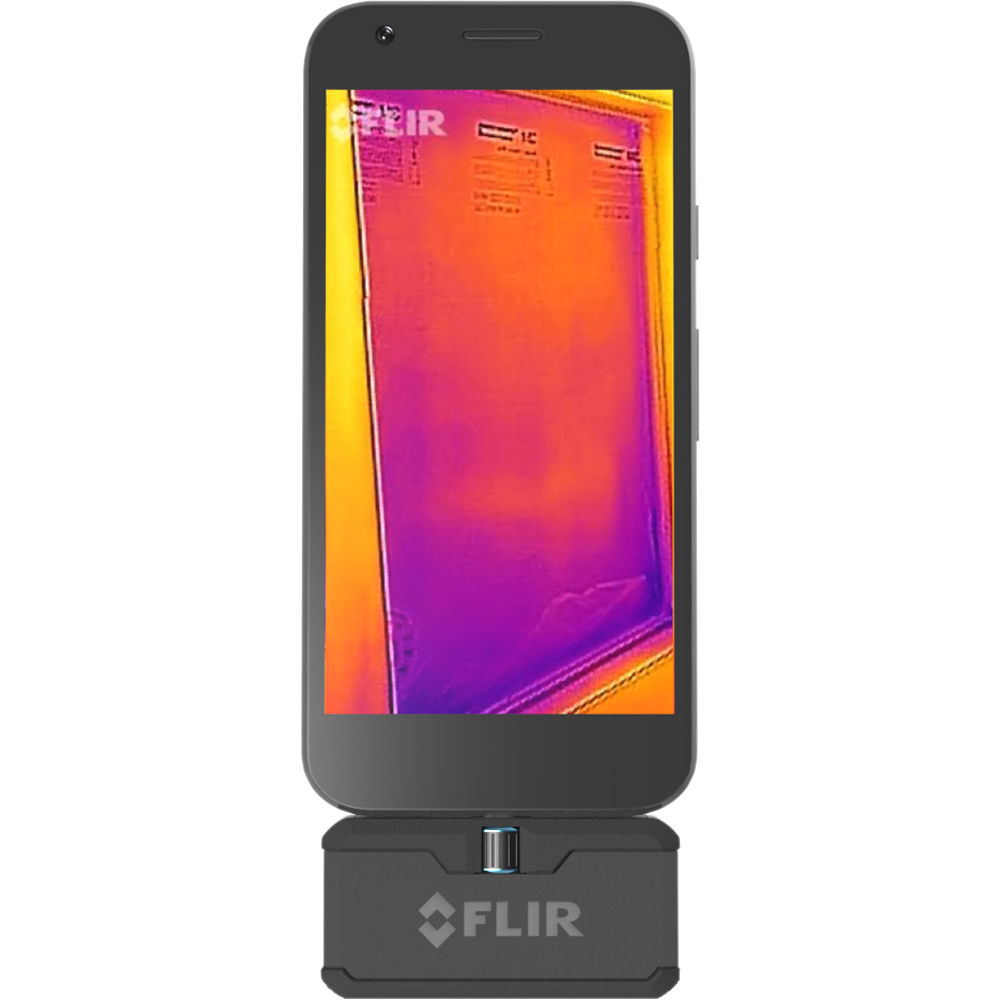
Figure 20: FLIR b40 infrared camera Figure 21: FLIR ONE Pro on a smartphone
However, I have a few warnings and lessons learned from my IR camera. I’ve gotten some pretty strange numbers from the temperature readout, so I rely on it more for the image than surface absolute temperature measurements. It seems like the phone battery drains quickly while running the software. Using this setup outdoors in winter results in really quick battery drain, so I need to tuck it into my coat between shots. Pairing infrared shots with visual shots (like I’ve done above) makes it much clearer what is going on in reports and presentations. Lastly—be careful of the connector that plugs into the phone: if you knock it around, it can fall right off (Figure 22). FLIR doesn’t repair these units, but they offer a discount on a replacement when sending back the broken unit.
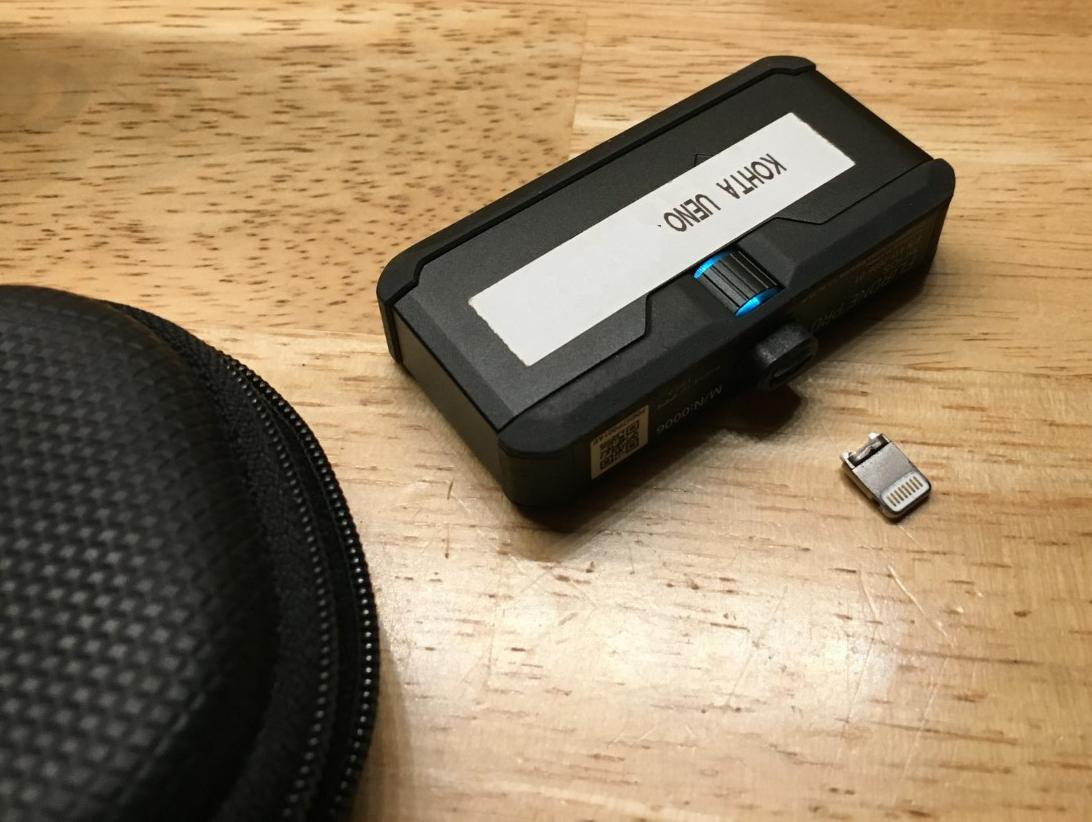
Figure 22: Breaking the connector off the FLIR ONE Pro
Shiny Surfaces and Furry Things
Infrared cameras rely on an assumed value for emissivity (ε) to work—emissivity is the “E” in window “low-E” coatings. Shiny surfaces have a low emissivity, and can result in weird results. Specifically, shiny surfaces reflect in infrared, the same way that mirrors do in the visual spectrum.
I ran into this while scanning hallways in a building (Figure 23): “Wow, some serious thermal anomalies at that elevator door… is there a massive summertime air leak?! Oh wait… that’s a reflection of me and a colleague, as well as the overhead lights…” Yes, I accidentally took an infrared selfie.
The same thing happens when you look up inside a suspended ceiling and point an infrared camera at shiny sheet metal ductwork… the “tell” is when that thermal anomaly starts moving around when you move.
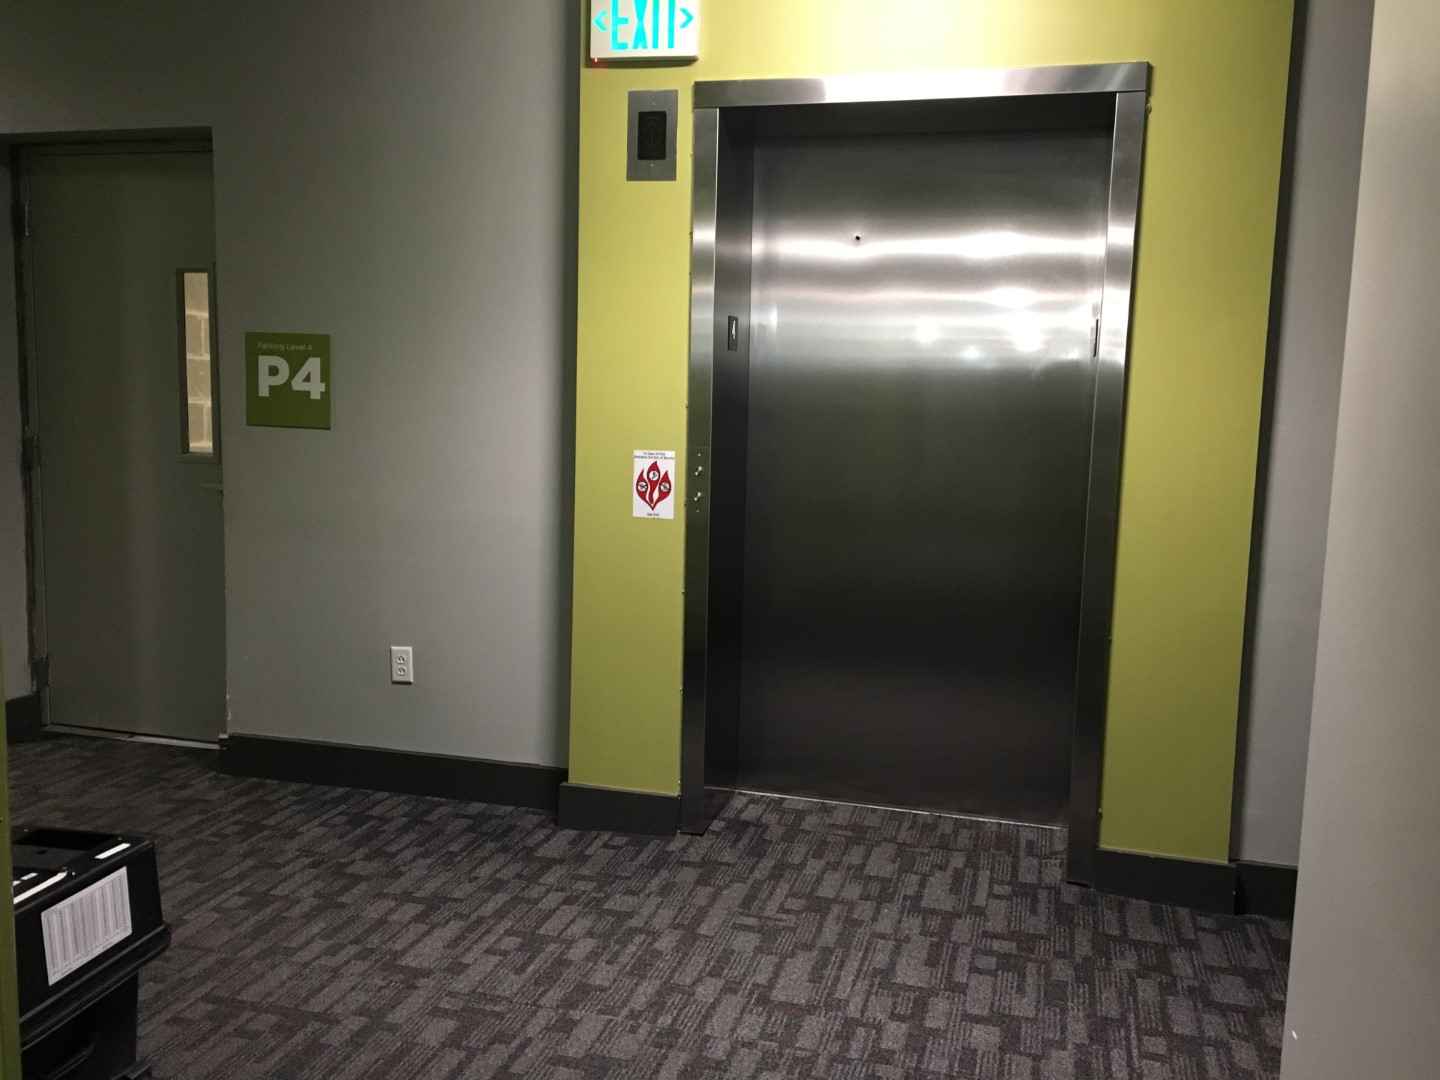
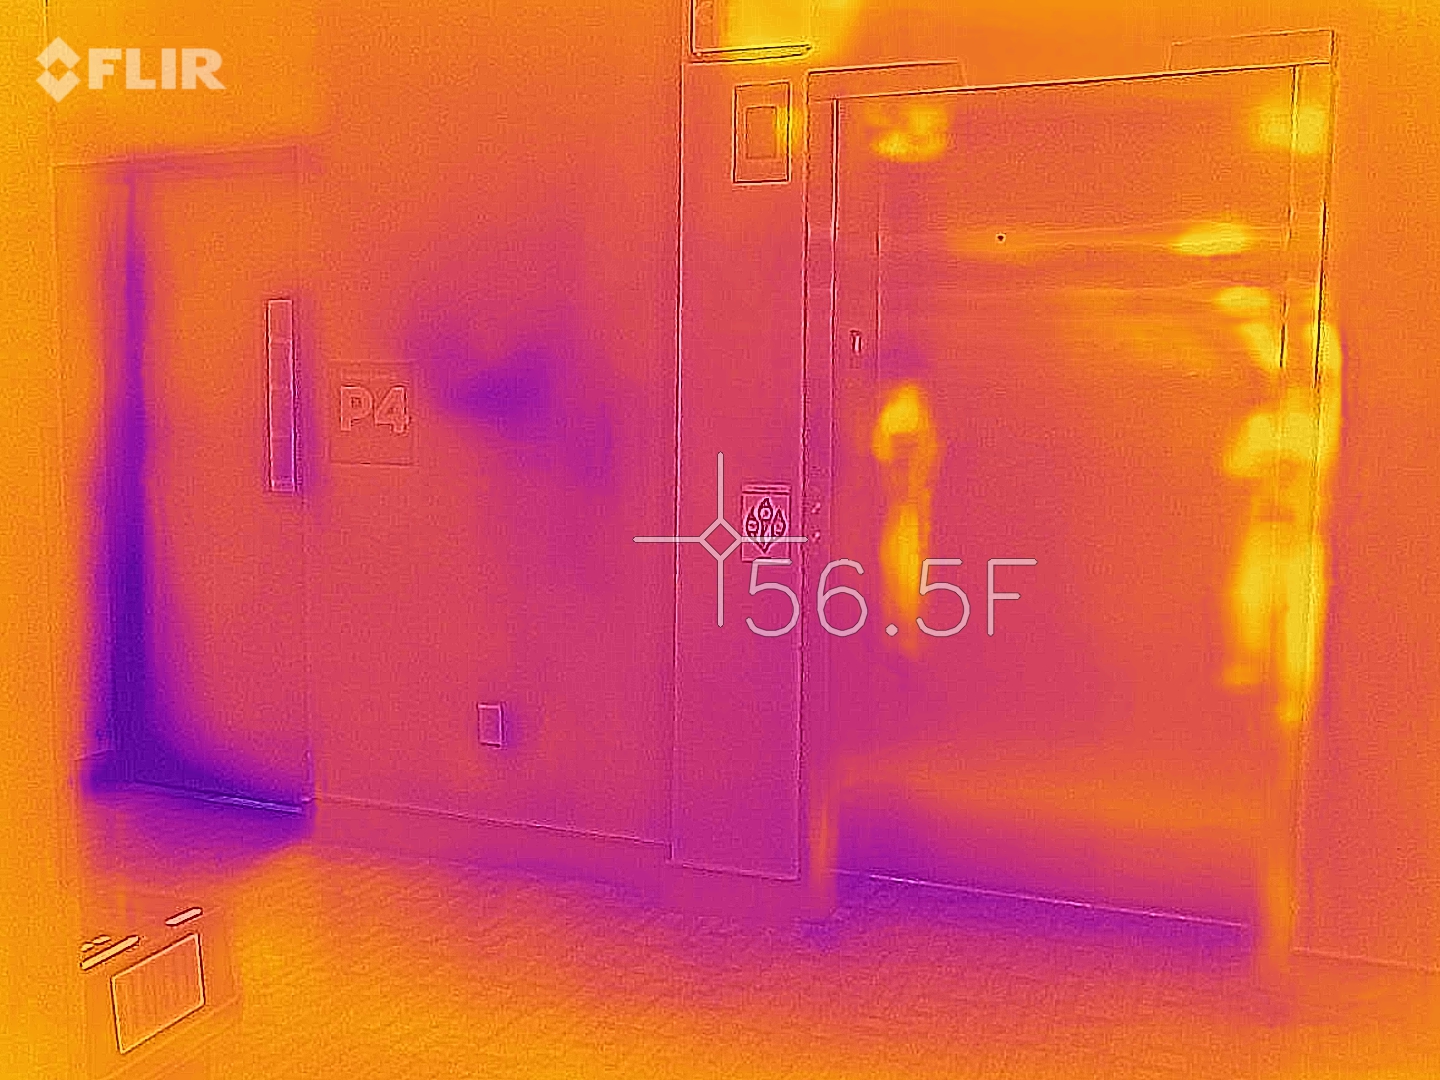
Figure 23: Infrared reflections on a shiny elevator door
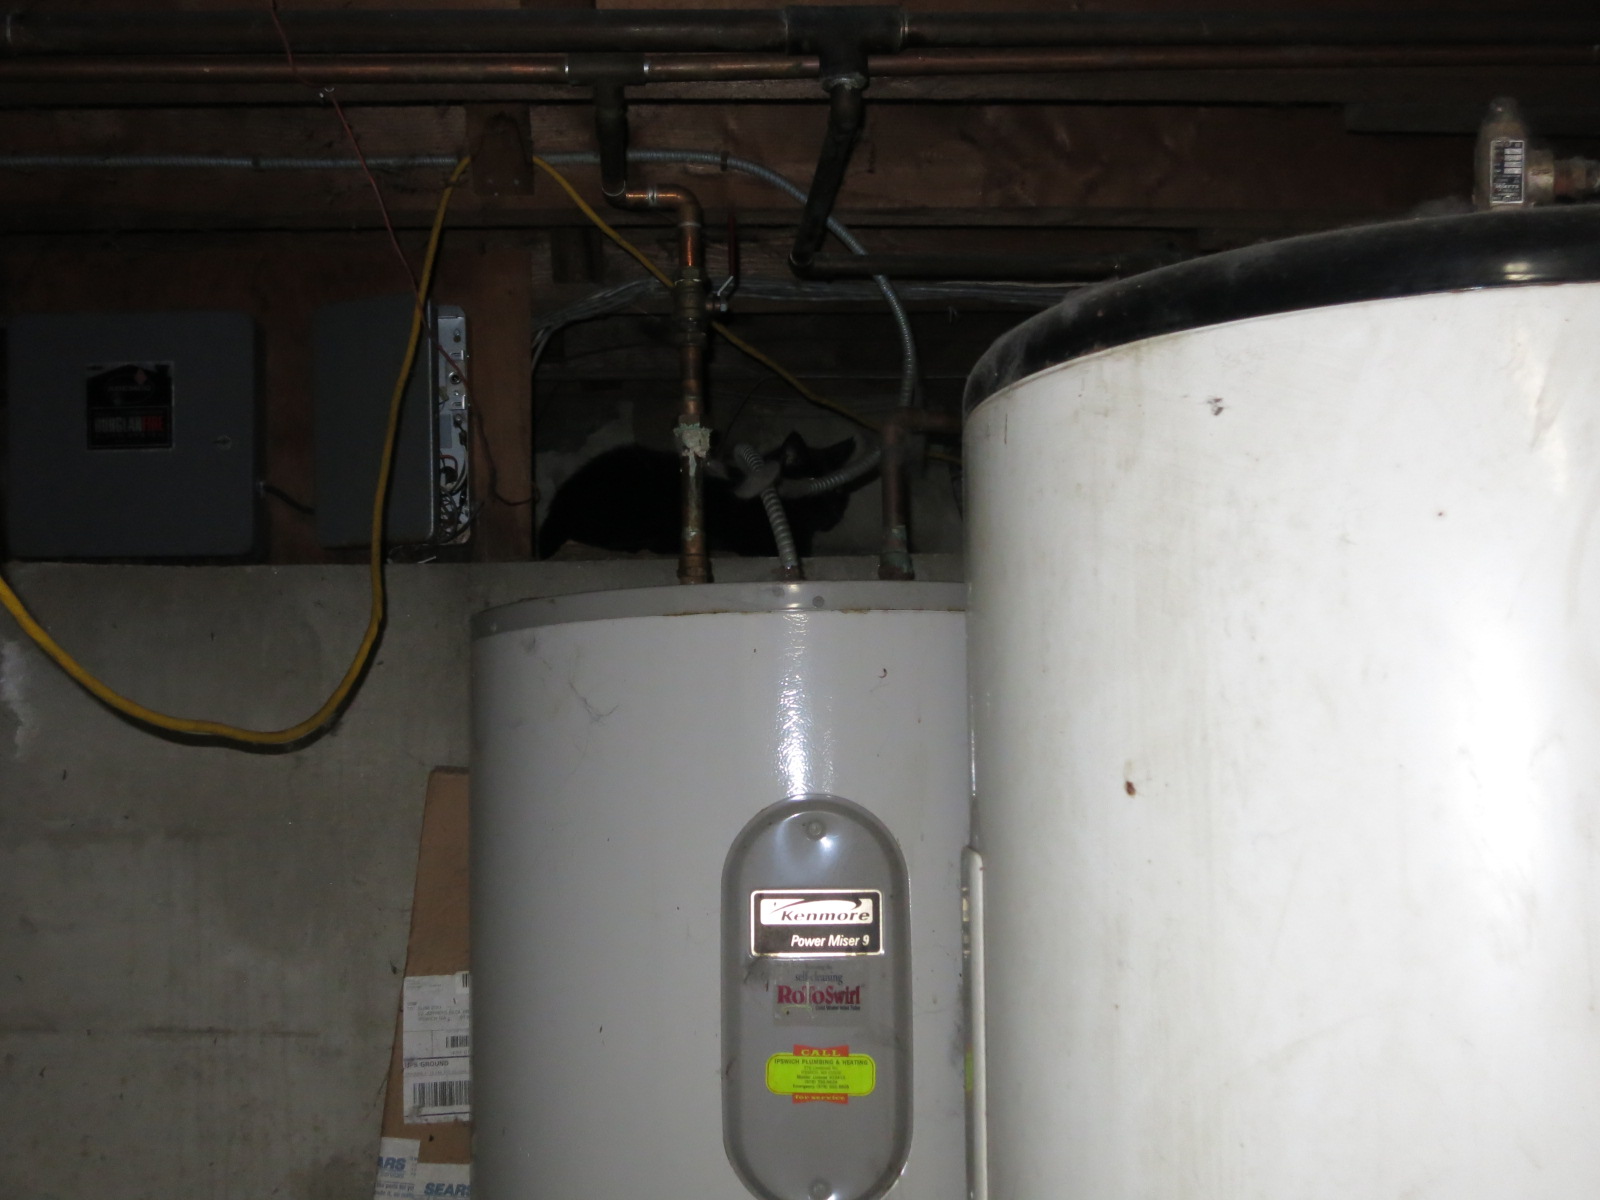
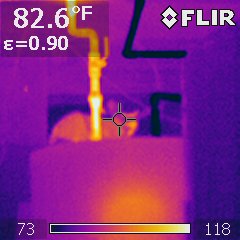
Lastly, you sometimes run into surprises with an infrared camera as shown in Figure 24. I was scanning a client’s basement… “Yep… cool basement walls, warm water heater, hot pipe, WHAT THE WHAT IS THAT?!” If you turn on a flashlight (or turn up the brightness in the visual shot), you’d see that the homeowner’s black cat likes to perch on the basement wall.