Tankless water heaters offer significant energy savings over conventional storage-tank water heaters, because thermal losses to the environment are much less. Although standard test results are available to compare tankless heaters with storage tank heaters, actual savings depend on the draw details because energy to heat up the internal mass depends on the time since the last draw. To allow accurate efficiency estimates under any assumed draw pattern, a one-node model with heat exchanger mass is posed here. Key model parameters were determined from test data. Burner efficiency showed inconsistency between the two data sets analyzed. Model calculations show that efficiency with a realistic draw pattern is ~8% lower than that resulting from using only large ~40 liter draws, as specified in standard water-heater tests. The model is also used to indicate that adding a small tank controlled by the tankless heater ameliorates unacceptable oscillations that tankless with feedback control can experience with pre-heated water too hot for the minimum burner setting. The added tank also eliminates problematic low-flow cut-out and hot-water delay, but it will slightly decrease efficiency. Future work includes model refinements and developing optimal protocols for parameter extraction.
Introduction
Tankless water heaters (TWH) save energy primarily by eliminating the energy losses associated with a storage tank, and their market share is increasing (1). Pros and cons of TWHs generally are shown in Table 1, with energy savings (see Table 2) probably the key factor driving increased interest. Savings are most often estimated using published energy factors [EF ≡ Qto load/Qin], which are measured at 64 gal/day usage with 6 draws of 10.6 gal each (2). Although reasonable for storage tank water heaters, using a few large draws unrealistically minimizes the impact of cycling of the heat exchanger mass with TWH. Each cool-down of that mass wastes a certain amount energy to the environment, and the more draws/per day there are, the more waste and inefficiency there is. Using an accurate simulation model will permit efficiency estimation for any draw pattern (e.g., that deemed best by a standards-making body). To make the simulation model accurate for a given unit while keeping the model simple, key model parameters should be derived from simple tests. In this paper, a model is proposed whose key parameters can be determined by tests which could be executed in under an hour.
Table 1: Pros and Cons of Tankless
| Pro/Advantages | Con/Disadvantages |
| Energy savings | Higher first cost/maintenance |
| Endless hot water | Increased hot water usage1 |
| Compact/space savings | Imperfect temperature control |
| Low weight | Minimum flow rate to turn on |
| Builder- & DIY-friendly | Limited capacity/hi-flow limit |
| Calif. Title 24 Credits | Delays in hot water delivery |
1. No hard data exists to support this reasonable conjecture.
Table 2: WH Energy Factors and Savings
| Water Heater | Energy factor1 | Savings2 |
| Gas storage tank | 0.55 - .63; > .883 | — |
| Gas tankless | 0.69 - .83; > .953 | ~25 - 45% |
1. Data taken from (2), except for condensing units
2. % savings = (EFtnkls — EFtank)/EFtank
3. Emerging condensing gas units, not uet listed (2)
There are two types of TWHs: gas and electric. For wholehouse applications, systems are predominantly gas because of the high power demand. For example demand is more than 200 kBtu/hr (30kW) at 6 gpm with a 70°F temperature rise. Gas TWH have somewhat larger savings potential than electric TWH do, because conventional gas tanks with their central flue design are more inefficient to begin with (EF ~0.58) compared to electric storage-tank water heaters (EF ~0.92). Although all the modeling introduced here applies equally to gas or electric systems with minor parameter changes, gas dominates the whole-house tankless market (1) and is of primary interest here.
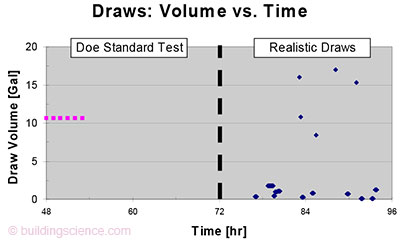
Savings from TWH are most often inferred from standard water heater tests (2). Typical EFs and estimation of savings are shown in Table 2. The test procedure specifies six equal draws of ~10.6 gal each, one hour apart, as in Fig. 1. The issue here is not with the total daily draw volume; 64 gal/day is a reasonable average. However, realistic usage invariably shows frequent small sink draws, as also shown in Fig. 1. This is of little consequence for storage water heaters, where the outlet temperature is mostly independent of draw volume, flow rate, and time (short of runout); but it is critical for tankless.

Figure 1: The standard test draw profile (left side), contrasted to a more realistic draw pattern (right side).
To analyze tankless efficiency, it is useful to define an efficiency for each draw:
ηdraw=Qout/Qin=[∫drawdt(mdotcp(Tout–Tin))]/{∫drawdtQdot,in} (1)
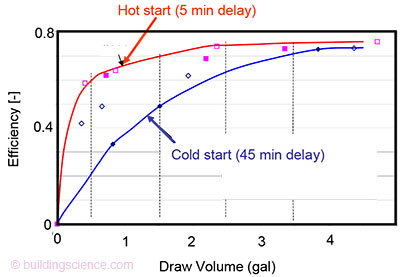
(see Nomenclature, Section 7, for definition of terms). In the standard test (2), ηdraw and the resulting EF are close to the burner efficiency ηburn, as the energy to charge up the heat exchanger is small compared to the draw energy. However, ηdraw is much lower than the EF for small draws, as shown in Fig. 2 (3). Thus, actual long-term efficiency of a TWH depends on the details of the draw schedule and will be generally lower than EFs published at (2). Actual draw patterns are very complex, and no draw pattern is universally accepted; each standards-making body or study will want to make their own assumptions. In this paper, a model is proposed that will allow reasonably-accurate calculation of efficiency for any assumed draw pattern.

Figure 2: Draw efficiency versus the volume of the draw, for 5 min. and 45 min. delay. Adapted from (3).
Table 3: Key Gas Tankless Parameters
| Parameter | Range1 | Tested unit2 |
| Energy factor | 0.69-0.84; >0.953 | 0.81 |
| Conversion efficiency | 0.79-0.85; >0.953 | NK4 |
| Maximum power | 100-200 kBtu/hr | 140 kBtu/hr |
| Minimum flow5 | 0.5 – 0.8 gpm5 | 0.75 gpm |
| Power modulation6 | Discrete and cont. | NM4; discrete? |
| Burner/bypass control | Varies | NM4 |
| Effective deadband | Varies | NM4 |
| Water content | .1 - 1 gal | NM4 |
| Delay in firing | 3 -10 sec | ~5 sec |
| Electric parasitic power (off//on)7 | 1 - 10W//30 - 100 W | 5 W//75 W |
- Data mostly from the tankless rating directory in (2).
- Manufacturer’s data; the unit is currently not listed at (2).
- For electric: ηbirm ≡ 1, and EF > .99. For gas, condensing units with EF > 0.95 are recently available.
- NM = Not measured, NK = not known
- Applies to all gas and electric/discrete units.
- Some TWH can vary continuously; others have discrete levels only.
- Electrical power includes microprocessor, controls/sensors, and fan(s), in both on and off states
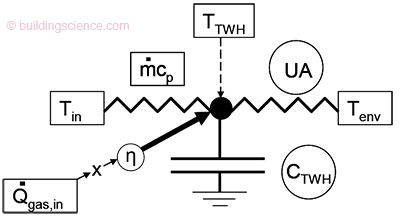
The model used here is shown in Fig. 3. It consists of a single lumped node for the heat exchanger and water mass, with coupling to Tenv, draw loss, and gas input. In reality, there is a temperature gradient along the heat exchanger, and higher order models will likely be needed ultimately. An energy balance on the mass node yields the equation:
C dT/dt = ηQdot,gas – mdotcp(T – Tin) – UA(T – Tenv) (1)

Figure 3: Tankless thermal circuit model. Variables in boxes are measured; parameters in circles are to be determined.
The modeling framework TRNSYS was used (4). Documentation of the tankless model can be found at (5). Constraints imposed on the model include: i) there is a userspecified delay after the draw starts before the burner ignites (~5 secs, for establishing fan flow and safety interlocks); ii) there is a minimum flow rate to actuate the burner (0.5-0.8 gpm); iii) there are minimum and maximum Qdot (for gas, Qdot,min is typically 10% to 20% of Qdot,max). The time step is subdivided into constant-Qdot portions as needed whenever controls change burner setting, and averages are computed over the time-step.
Qdot can be continuous or discrete. Controls for the discrete case use a “feedback + deadband” approach. At start of a time-step, if mdot > mdot,min, the burner was previously off, and (Tout Tset), Qdot is set to Qdot,max. If (Tout > Tset) occurs during the time-step, the burner is re-set downward one step. If (Tout>Tset) occurs at Qdot,min, then the burner is turned off. Then, when (Tout
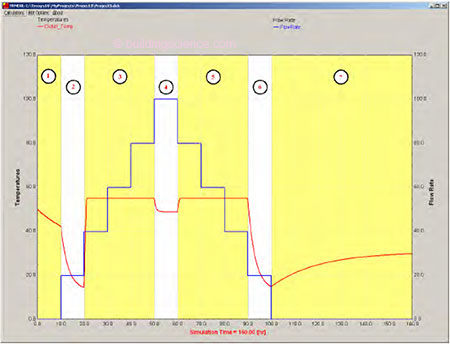
New models should first be validated analytically insofar as possible. Fig. 4 shows the model response to varying flow rate, to compare to expectation. In region 1, there is decay from a previous firing toward Tenv. In region 2, a draw is initiated with mdot

Figure 4: Model response to varying flow rates. The red line is Tout, and the blue line is mdot,in. . .
Download complete document here.
