It is just shocking, just shocking that some molecules have a positive electrical charge and a negative electrical charge. Water is a molecule with one oxygen and two hydrogen atoms held together with a covalent bond at an angle of 104.5 degrees (Figure 1) resulting in a permanent dipole (Figure 2). The polar nature of the water molecule causes magic and mystery to happen with its interaction with other materials.
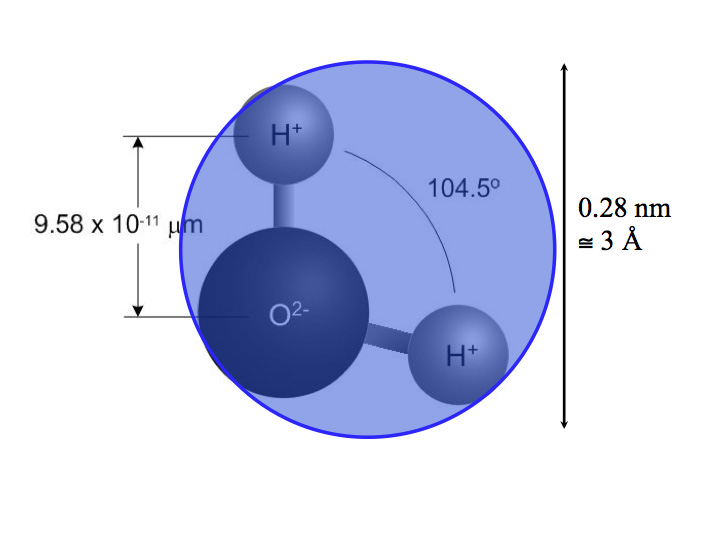
Figure 1: The Water Molecule – A permanent dipole.
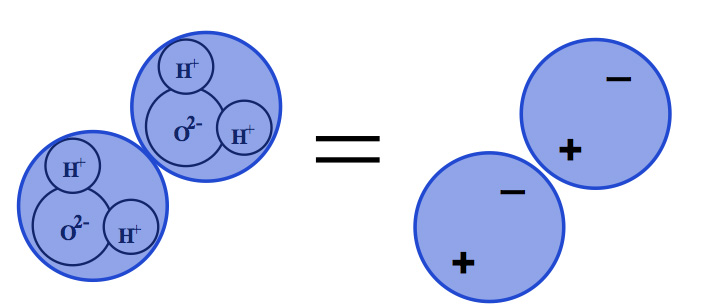
Figure 2: Sticky Stuff – Because it is a polar molecule water likes to stick to itself and to other things.
Water likes to stick to itself and stick to other things…it sure is sticky. Hydrogen bonding, among other forces, causes the water molecule to cling to other molecules resulting in adsorption. This has consequences. Many materials “can capture water molecules from the air and localize them on their surfaces…such water is said to be in the adsorbed state”[1].
Adsorbed water is kind of like a 4th state of matter (Figure 3). Apologies to the physicists for what comes next…a breach of protocol for sure. Here goes. Adsorbed water is not quite a liquid. But it is a liquid…sort of. It has weird properties. It sticks to surfaces in “monolayers” (Figure 4). The number of monolayers is directly related to relative humidity. Let me explain why this is weird. Relative humidity is not absolute humidity or vapor pressure. The sheer number of water molecules in the air adjacent a surface is not as important as the relative amount of water molecules in the air adjacent the surface compared to the total amount of molecules that can be in the air adjacent the surface. This is nuts….but it is so.
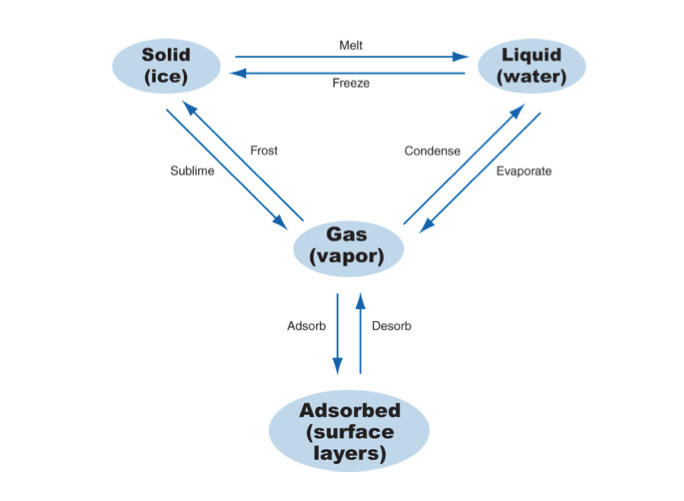
Figure 3: Four “Phases” of Water – Adsorbed water is not quite a liquid. But is sort of like a liquid. This is adapted from Kumaran, 2002.
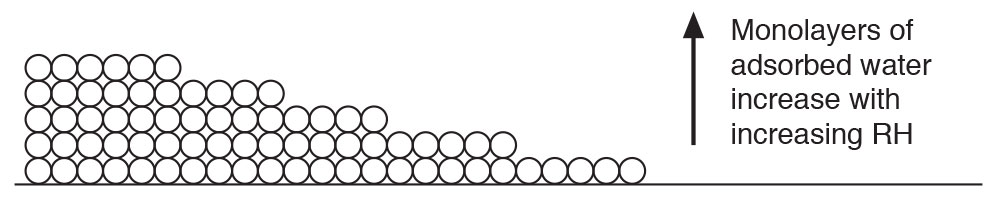
Figure 4: Monolayers of Water – The number of monolayers is directly related to relative humidity. Note that surfaces are never “flat” as shown…
More weird coming. No more than 5 monolayers of water molecules can stick to a surface[2]. Don’t know why. Find the ghost of Edward Teller[3] and ask him. The first monolayer of water is really, really stuck to the surface. The second monolayer not so much because it has to stick “through” the first monolayer. The third has to stick “through” two monolayers and so on. Until you get to the fifth monolayer which is pretty weak. This is the basis of multilayer sorption – the BET theory – named after Brunauer, Emmet and Teller – the guys who came up with it.
This adsorbed water layer tends to move along a surface following a concentration gradient….from more to less…more 2nd Law stuff (Figure 5). The process is called surface diffusion. Think about this for a minute. The molecules of water flow along the surface according to the concentration gradient….but they don’t get to the surface necessarily because of a concentration gradient. Yup, weird. They change their behavior once they get to where they are going.
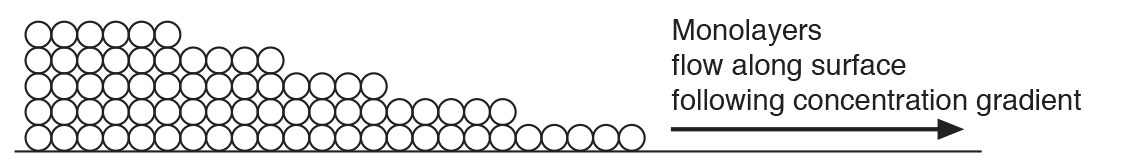
Figure 5: Surface Diffusion – Adsorbed water moves along a surface following a concentration gradient. Note that reality does not have such clean straight surfaces…..
Most of our building materials are porous in nature. This of course is obvious. What is also obvious is that the pores are not all of uniform size. Some pores are big. Some are small. Some are in between. Yes, this is obvious as well. As the relative humidity goes up the number of monolayers of adsorbed water go up. Yes, we just covered that. This means that the small pores get filled up before the large pores get filled up (Figure 6). This is also obvious. What comes next is not. Just as the small pores get filled the pore opening “sees” a depression….a curvature. We call this curved surface a “meniscus”…after the Greek meaning “crescent-shaped” moon. Now we need help from Lord Kelvin. The Kelvin equation shows that a reduction in vapor pressure over a curved meniscus results in capillary condensation. Wow. The practical implications are huge. This means we can get condensation on porous surfaces at relative humidities less than 100 percent. The condensation occurs in the pores. Did I mention huge?
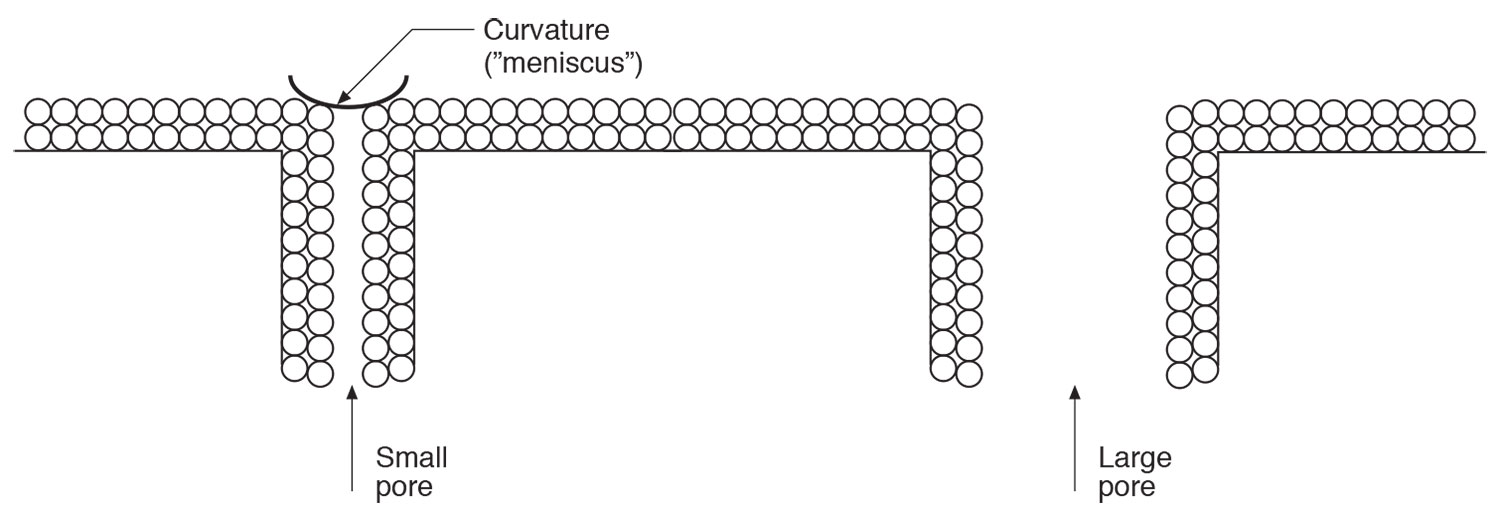
Figure 6: Capillary Condensation – Small pores get filled before large pores. A reduction in vapor pressure over a curved surface results in capillary condensation. Thank Lord Kelvin for this. Once again that the real world is not as “crisp” and “clean” as drawn.
Let’s say you are a microbiologist and you are studying mold and you know that mold needs liquid phase water to do its thing….how do you explain that mold happens on paper faced surfaces at 80 percent relative humidity? Ah, easy, thanks to Lord Kelvin and capillary condensation. At 80 percent relative humidity you get liquid phase water in the pores of the paper faced gypsum due to capillary condensation (Photograph 1).
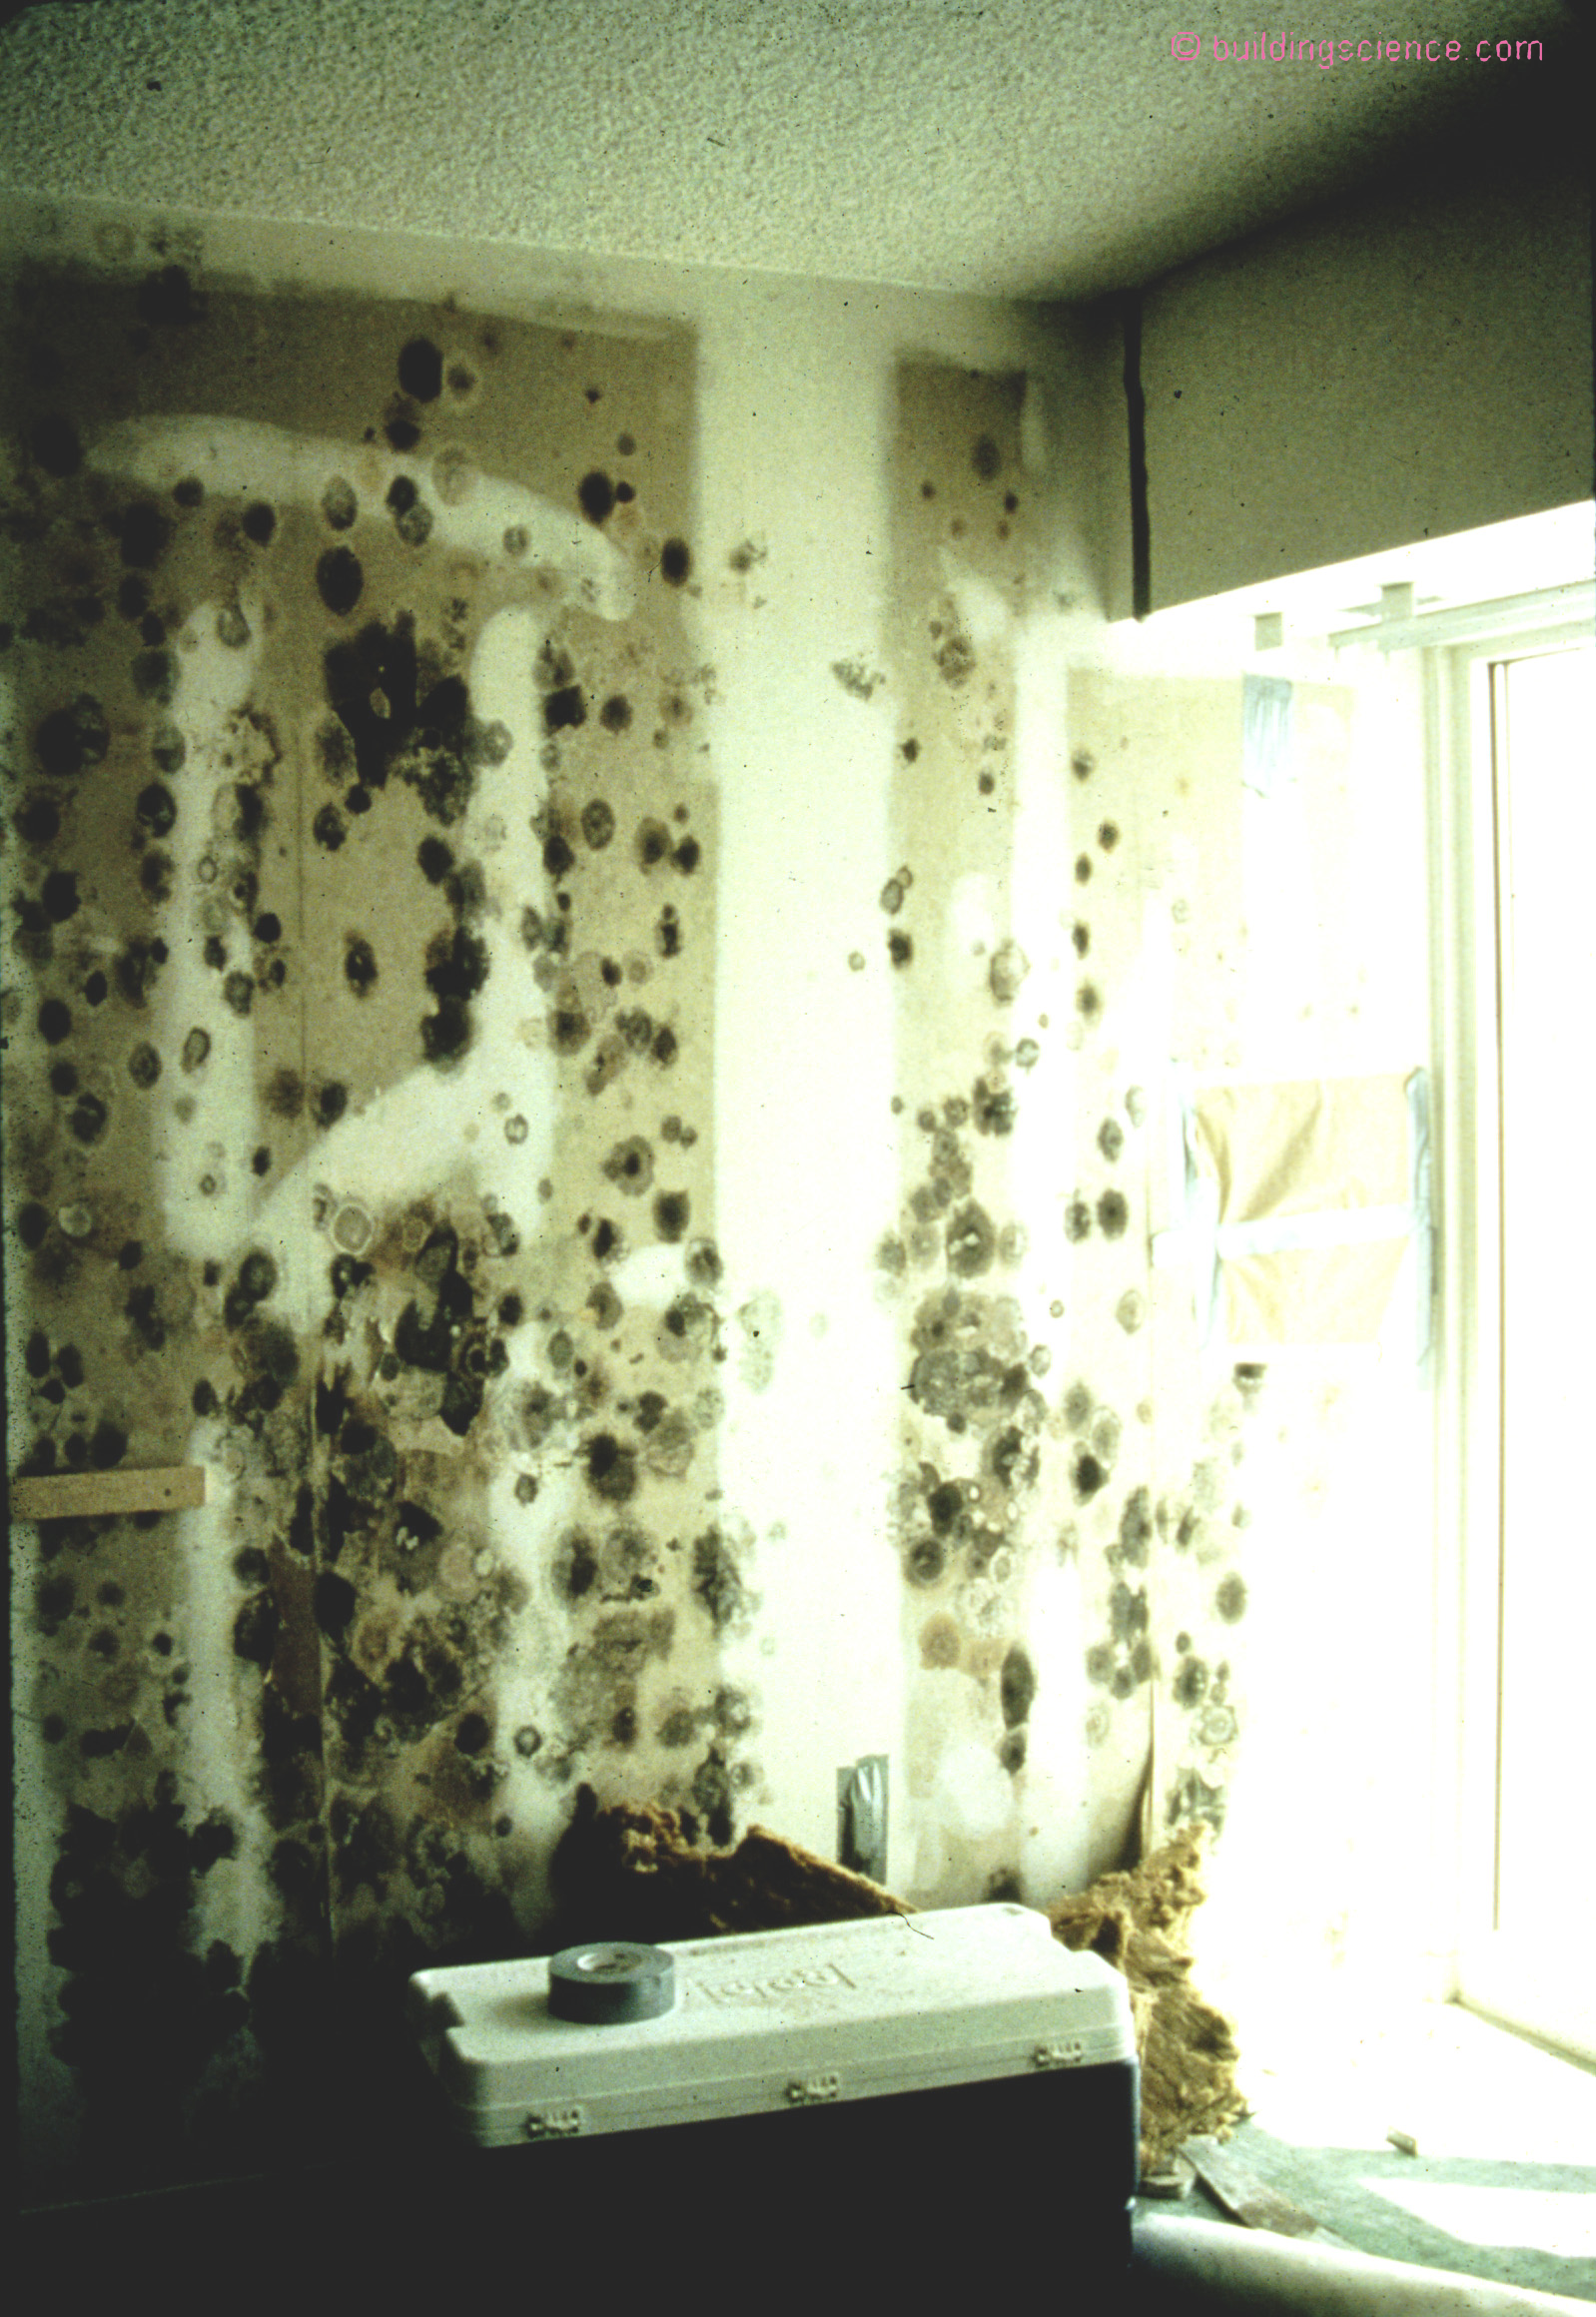
Photograph 1: Capillary Condensation and Mold - We can get condensation on porous surfaces at relative humidities less than 100 percent. The condensation occurs in the pores. Mold needs liquid phase water to do its thing yet mold happens on paper faced surfaces at 80 percent relative humidity. Thanks to Lord Kelvin and capillary condensation at 80 percent relative humidity you get liquid phase water in the pores of the paper faced gypsum due to capillary condensation.
The affinity of a material for water vapor is described by a sorption curve. More formally the moisture content of a material in equilibrium with most air is referred to as a sorption isotherm. Today, we have pretty good theory to go with measurements. The most widely accepted adsorption theory today is BET (after Brunauer, Emmet and Teller) as improved by Rounsley (1961) with a dose of Lord Kelvin (Figure 7).
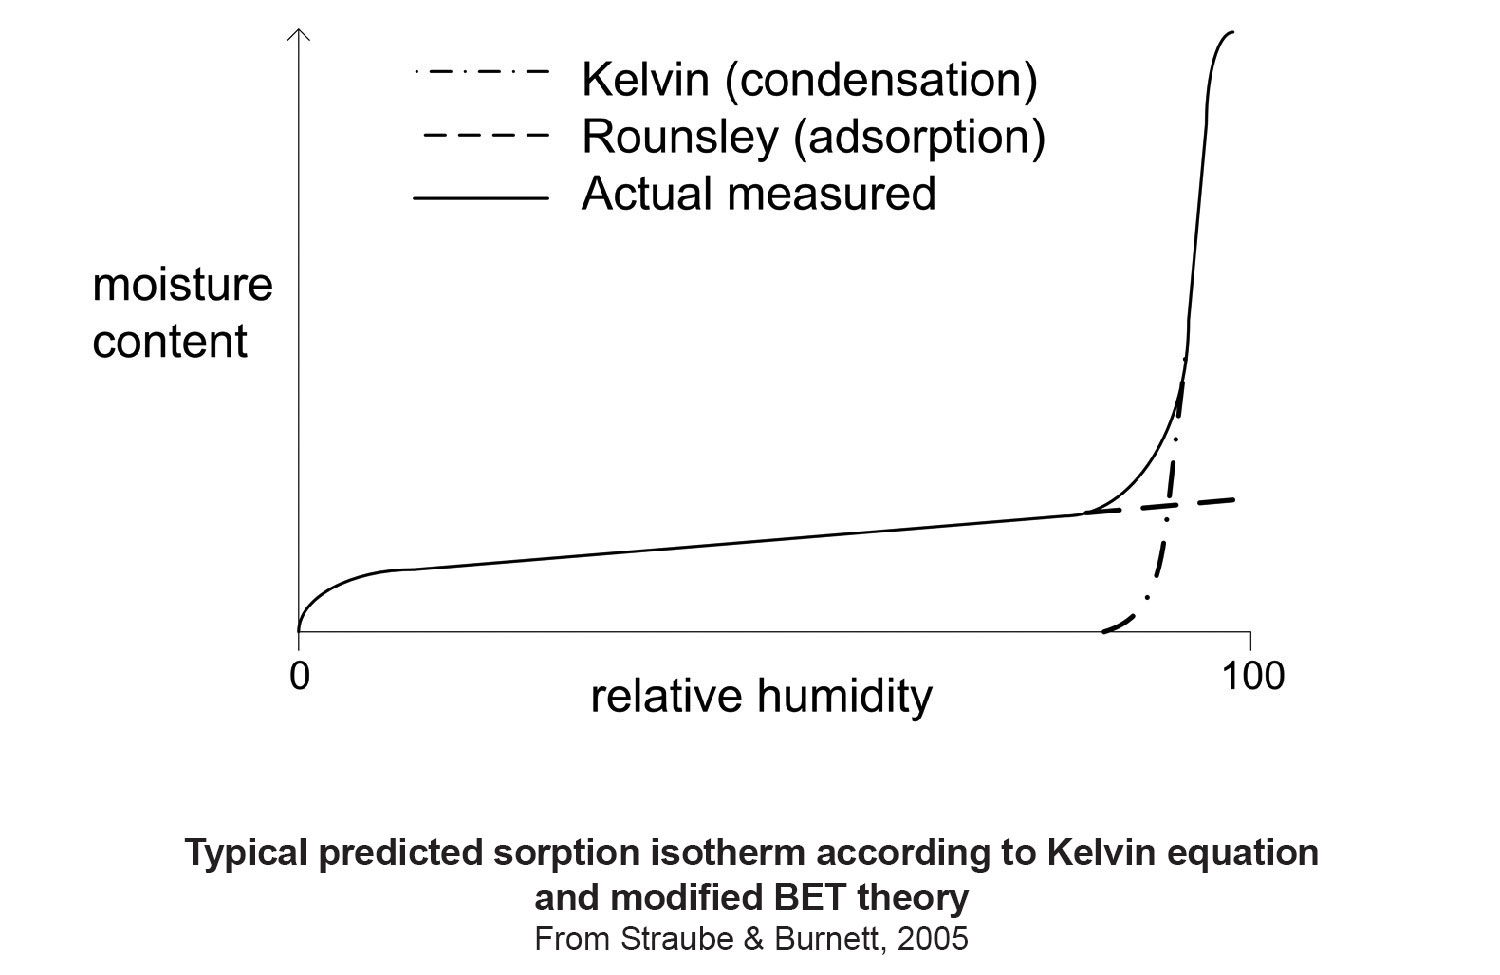
Figure 7: Adsorption Theory - The most widely accepted adsorption theory today is BET (after Brunauer, Emmet and Teller) as improved by Rounsley (1961) with a dose of Lord Kelvin.
Figure 8 shows sorption isotherms for common building materials – courtesy of Kumaran by way of Straube and Burnett (2005). Notice that the horizontal axis is relative humidity and the vertical access is moisture content. So why should we care? If we replace the vertical axis with vapor transmission in permeability we get pretty much the same shape of curve. For many materials as relative humidity goes up so does vapor transmission. There is a dramatic change in vapor permeability with relative humidity due to adsorbate transport, capillary transport and liquid transport. This is huge, huge, huge and huge. We can do “magic” things with building materials and assemblies with these properties.
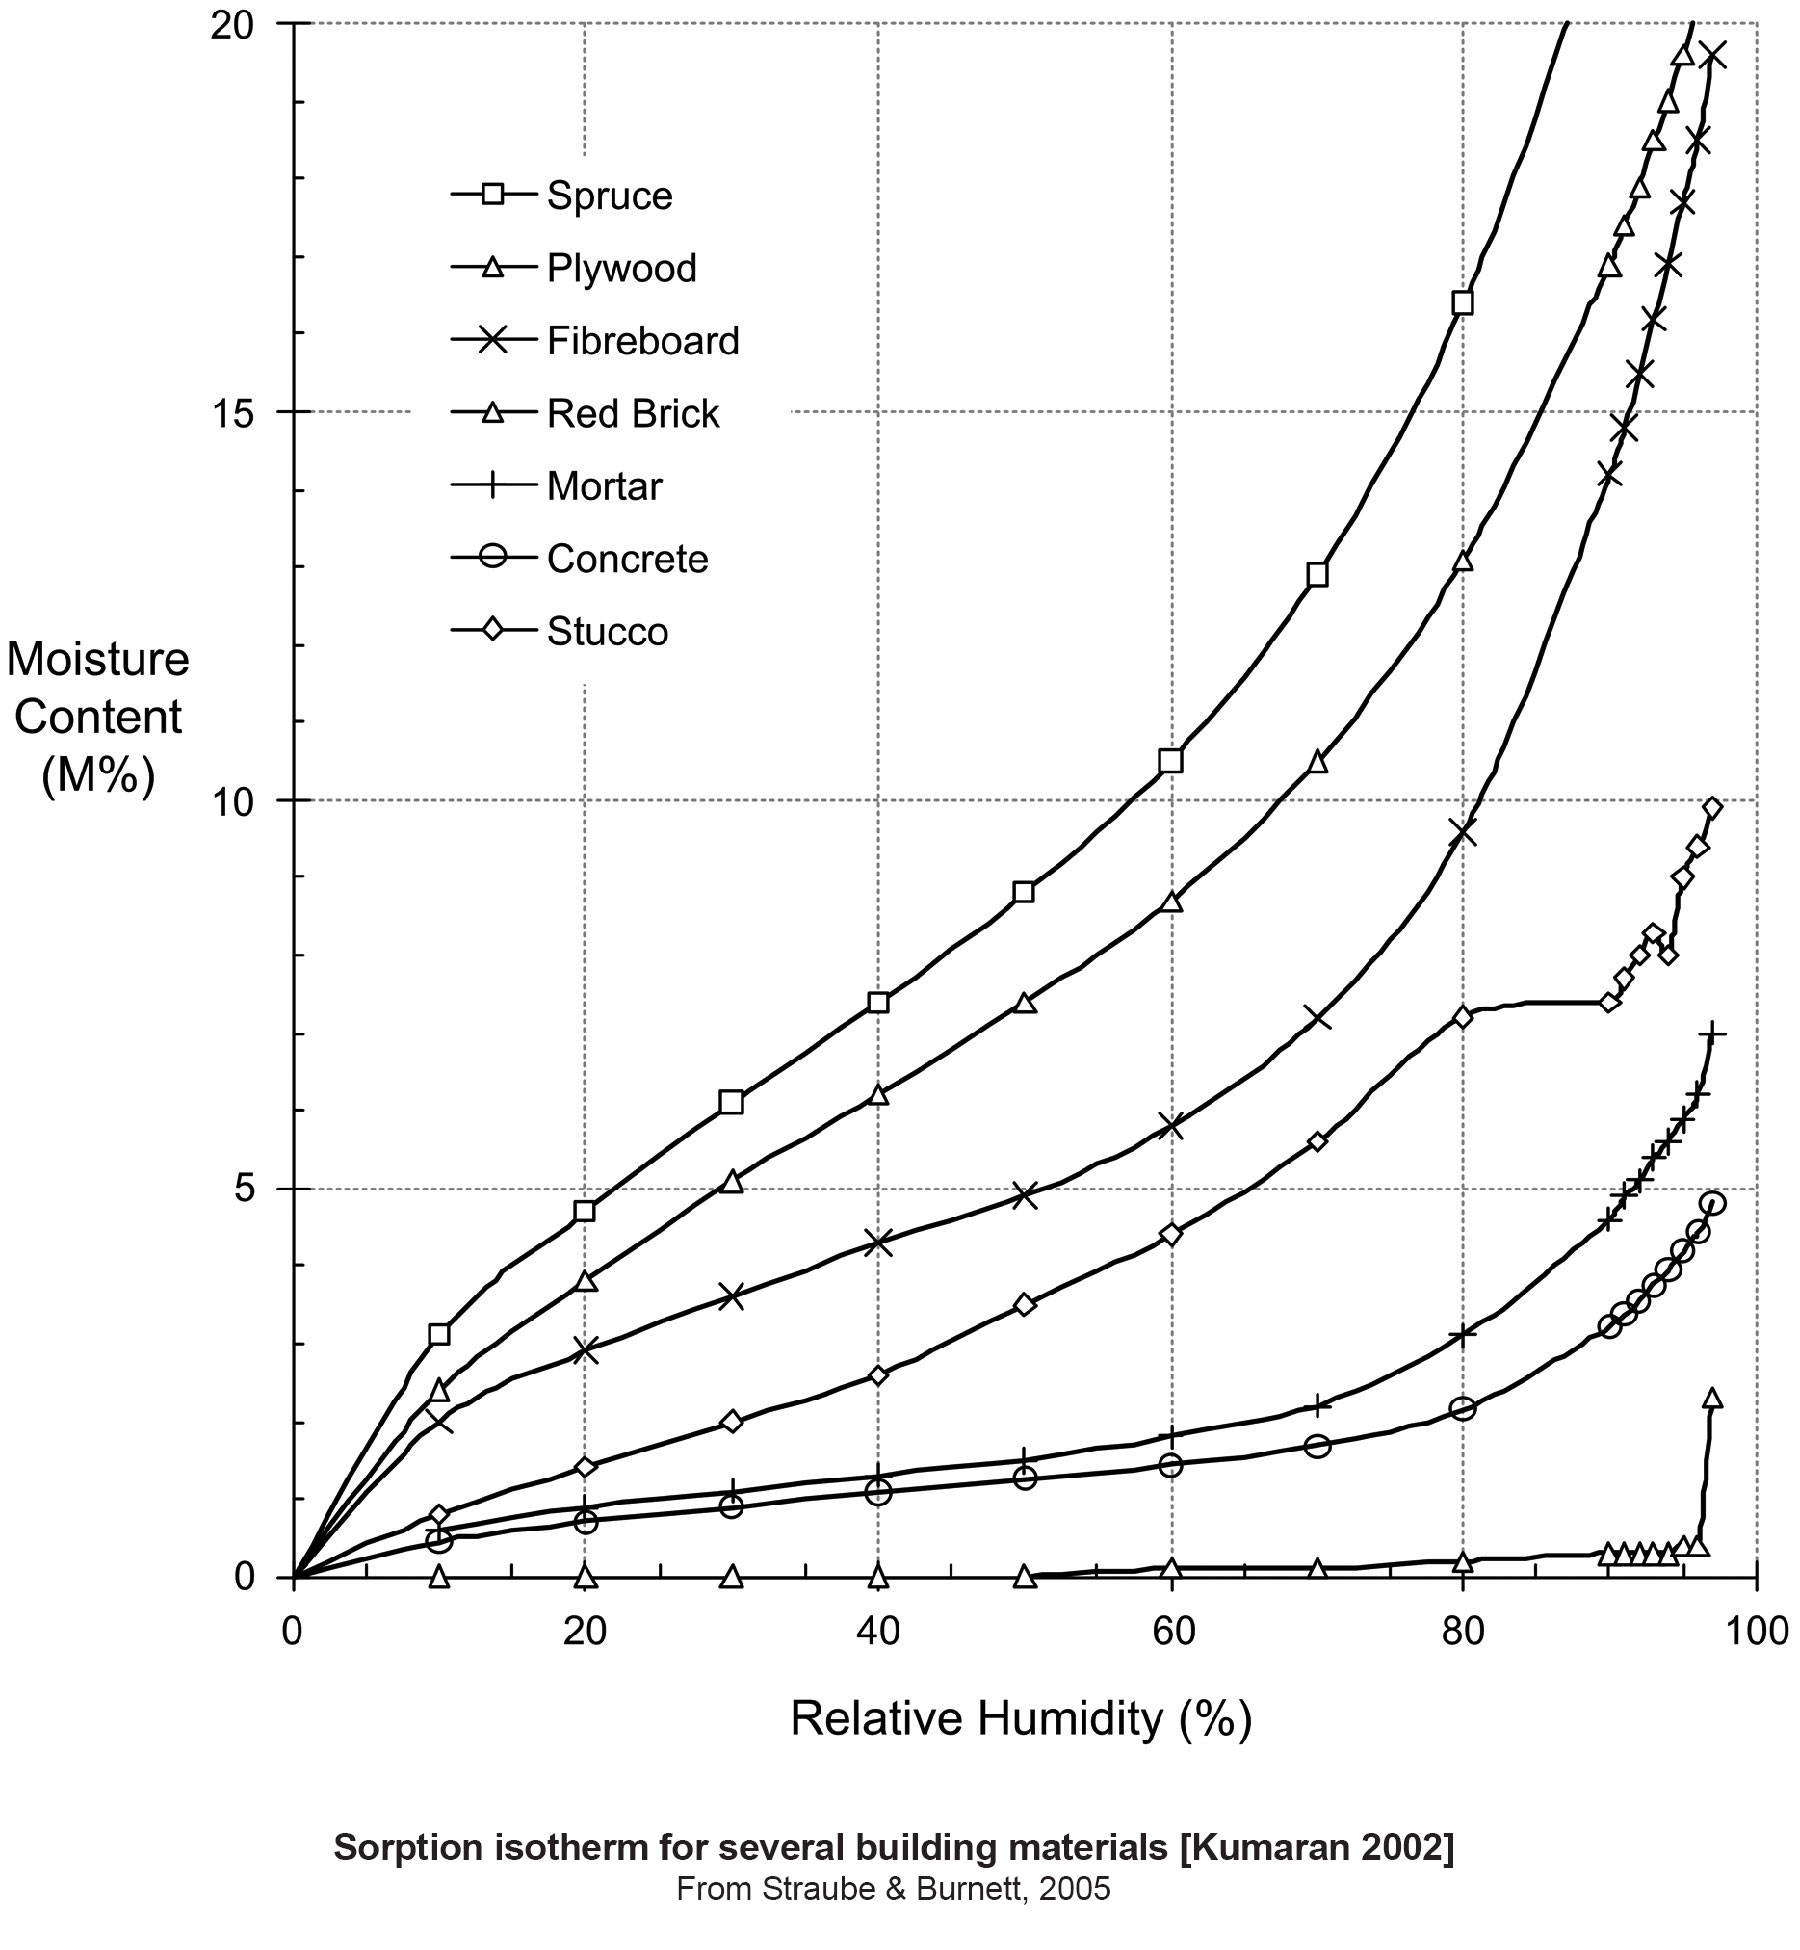
Figure 8: Sorption Isotherms - Common building materials sorption isotherms– courtesy of Kumaran by way of Straube and Burnett (2005).
We measure these properties using what youngsters today refer to as old technology: “dry cup”, “wet cup” and “inverted wet cup” tests (Figure 9).[4] We have two legends to thank for the tests: Frank Joy and Grant Wilson. More than a half a century has gone by and they still set the “standard”.
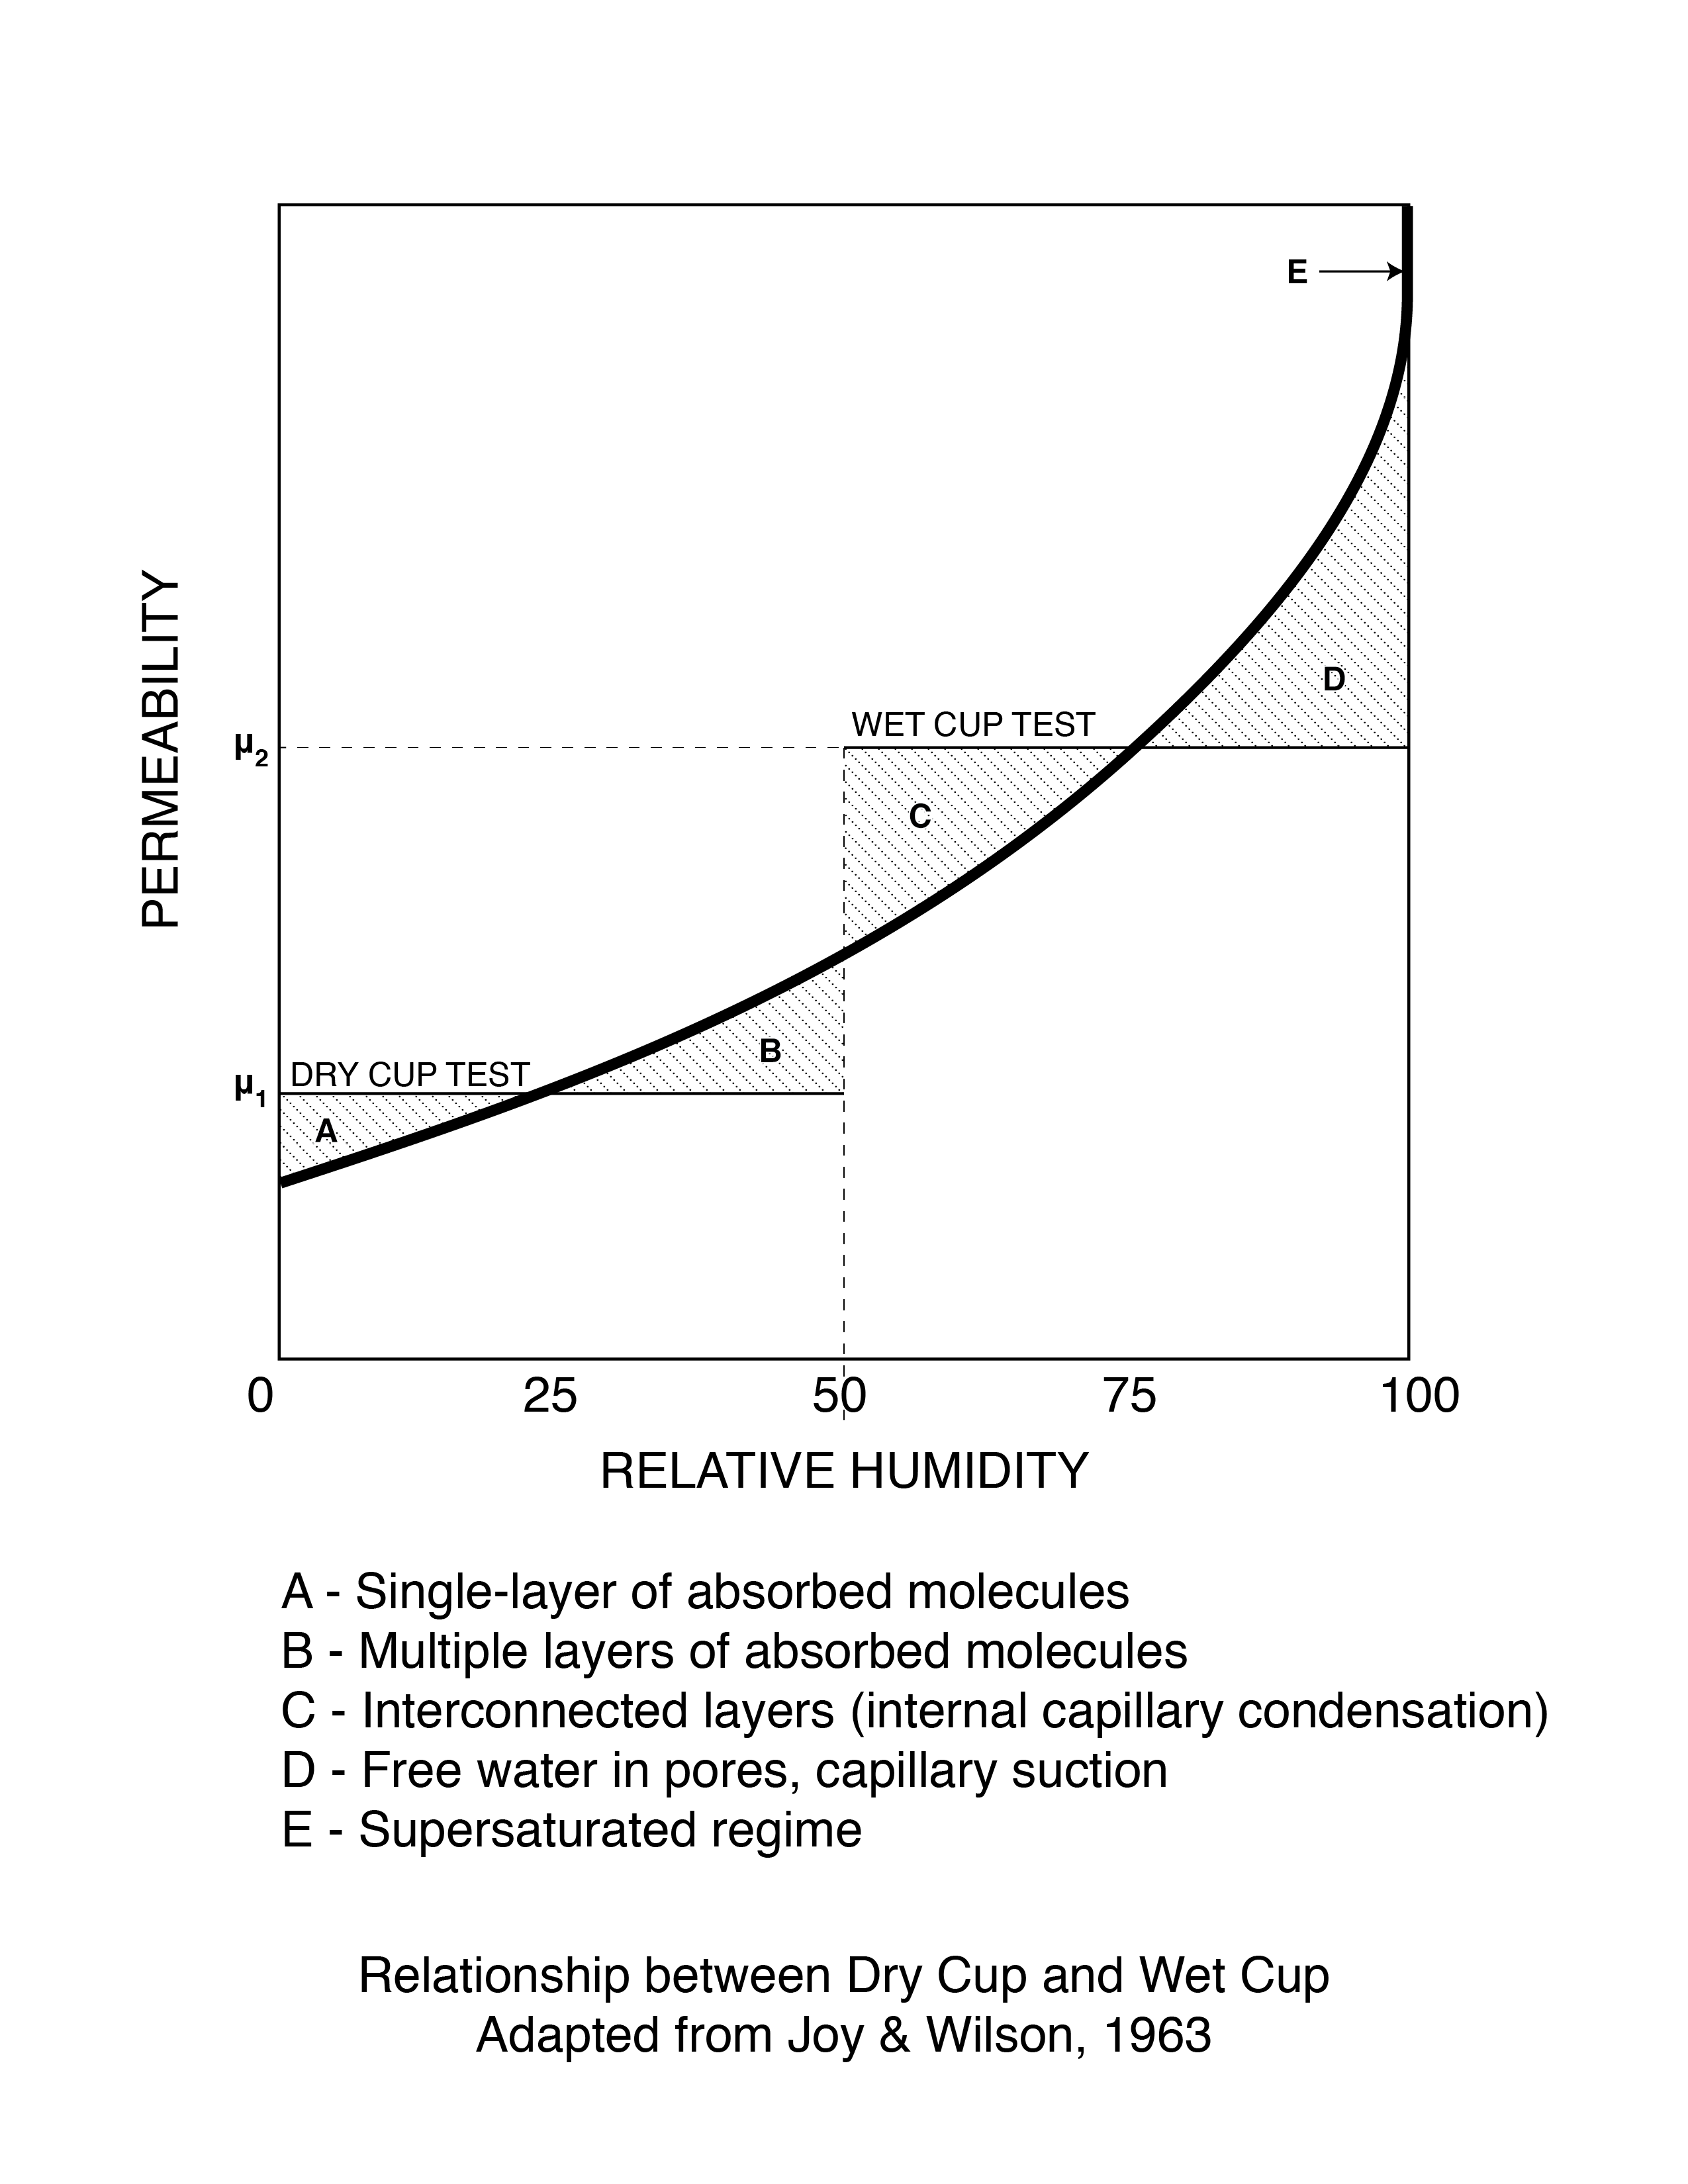
Figure 9: Dry Cup vs Wet Cup - The zones described as A, B, C, D and E in Figure 9 represent the moisture transport processes involved. As relative humidity goes up the material goes from single layer adsorbate transport to multiple layer adsorbate transport to internal capillary condensation to free water capillary suction and finally to supersaturated flow.
For a dry cup test you place the material you want to “test” over a “cup” that has a desiccant in it. The material is sealed with wax to the edge of the cup. The cup is placed in an environmental chamber maintained at room temperature and 50 percent relative humidity. So one side of the material – the “cup side” - “sees” 0 percent relative humidity and the top side “sees” 50 percent relative humidity. Water molecules migrate from the environmental chamber through the material into the cup and are absorbed by the desiccant. The cup gains weight over time and this increase in weight over time determines the “dry cup” vapor permeability of the material.
For a wet cup test the desiccant is replaced with liquid water. The “cup side” of the material now “sees” 100 percent relative humidity and the top side – the environmental chamber side “sees” the same 50 percent relative humidity as before. The water molecules now move in the opposite direction and the cup loses weight over time and this determines the “wet cup” vapor permeability of the material.
For the inverted wet cup test turn the wet cup upside down – “invert” it. Now we have liquid water on the “cup side” of the material in direct contact with the material.
Pretty neat, eh? The zones described as A, B, C, D and E in Figure 9 represent the moisture transport processes involved. As relative humidity goes up the material goes from single layer adsorbate transport to multiple layer adsorbate transport to internal capillary condensation to free water capillary suction and finally to supersaturated flow.
On to the magic part. Check out the “asphalt coated kraft paper” in Photograph 2 on the interior side of a fiberglass batt cavity insulation and look at Figure 10 that graphs the permeance of interior wall assembly linings vs relative humidity. The kraft facing has a “dry cup” value of 1 perm and a “wet cup” value of 15 perms. In most of the United States and Canada buildings in the winter have low interior relative humidities – around 25 percent and high interior relative humidities during the summer – 60 percent and higher. The kraft facing works much like a “valve”….closed in the winter and open in the summer. It reduces wetting from the interior during the winter but allows inward drying during the summer. In an air conditioned building it is a bad idea to have an interior vapor barrier. The kraft facing is not an interior vapor barrier during cooling periods as its valve is open. During the winter the kraft facing is a vapor retarder throttling the outward flow of vapor from the interior. Awesome. That is why we call kraft facing a “first generation smart vapor control layer”. How about that, more than a half century old “smart” membrane.
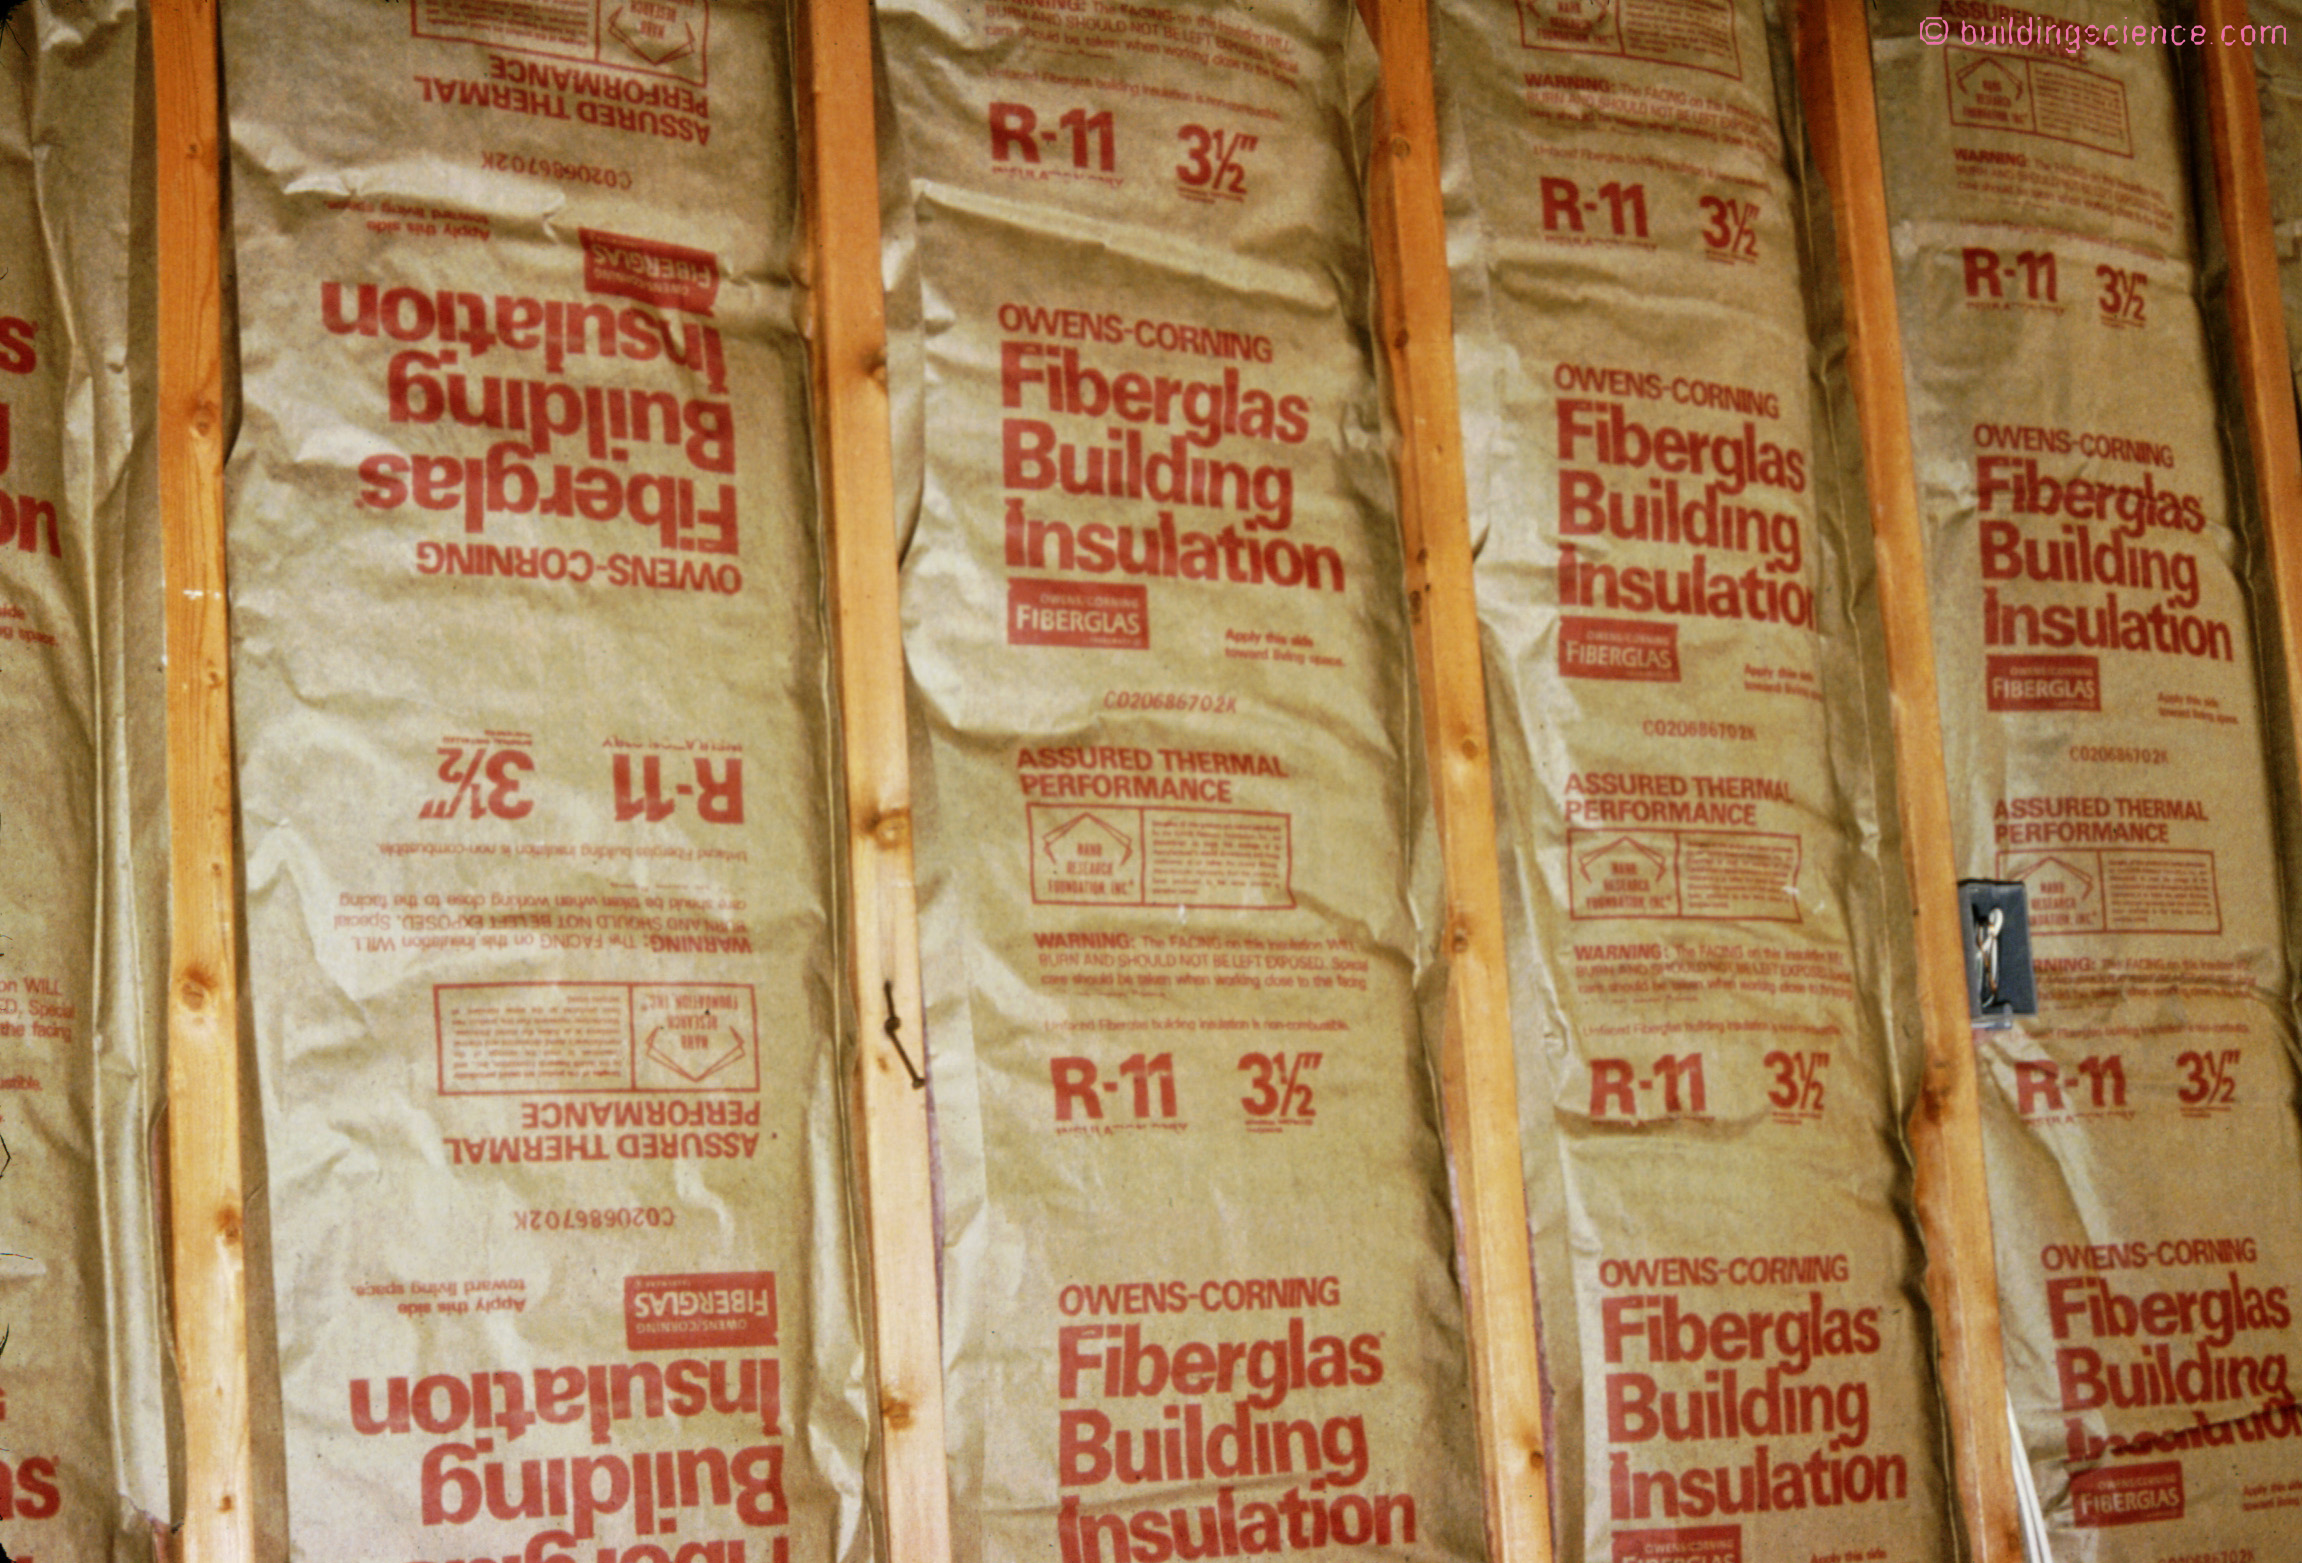
Photograph 2: Magic Valve – The asphalt coated kraft facing on the interior side of fiberglass batt cavity insulation changes its vapor transmission according to relative humidity.
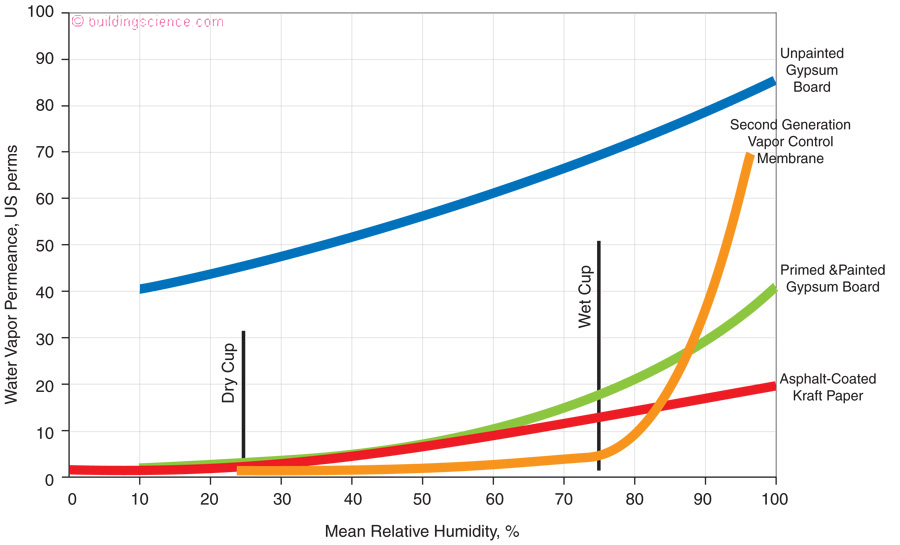
Figure 10: Permeance of Interior Wall Linings - The kraft facing has a “dry cup” value of 1 perm and a “wet cup” value of 15 perms. In most of the United States and Canada buildings in the winter have low interior relative humidities – around 25 percent and high interior relative humidities during the summer – 60 percent and higher. The kraft facing works much like a “valve”….closed in the winter and open in the summer.
Today we have extremely “smart” vapor control layers – second generation smart control layers”. To understand their significance and therefor underlying performance both dry cup and wet cup properties need to be appreciated. And in some cases inverted wet cup properties. Dry cup by itself does not tell the story. The “inflection points[5]” for the sorption curves of these layers are “engineered” to provide control that otherwise would not be possible. In this case “inflection points” translates into “valve” opening and closing. “Smart vapor barriers” on the interior are truly smart. In many cases insulating the interior of mass walls would not be possible without this type of technology.
Lets go look at Figure 11 the vapor permeance of materials on the exterior of wall assemblies. For many years folks have been obsessing over the ability of assemblies to dry to the exterior. Look at the shape of the curves for the traditional materials: impregnated felt and asphalt saturated kraft (ASK). Notice how the bend upward past 50 percent relative humidity. Valves again, eh? Hard to knock the old materials. They were pretty darn “smart”. Trouble was they tended to blow off and hard to put up…. but what made them “better” than most appreciated was their wet cup properties. Again, dry cup by itself does not tell the story.
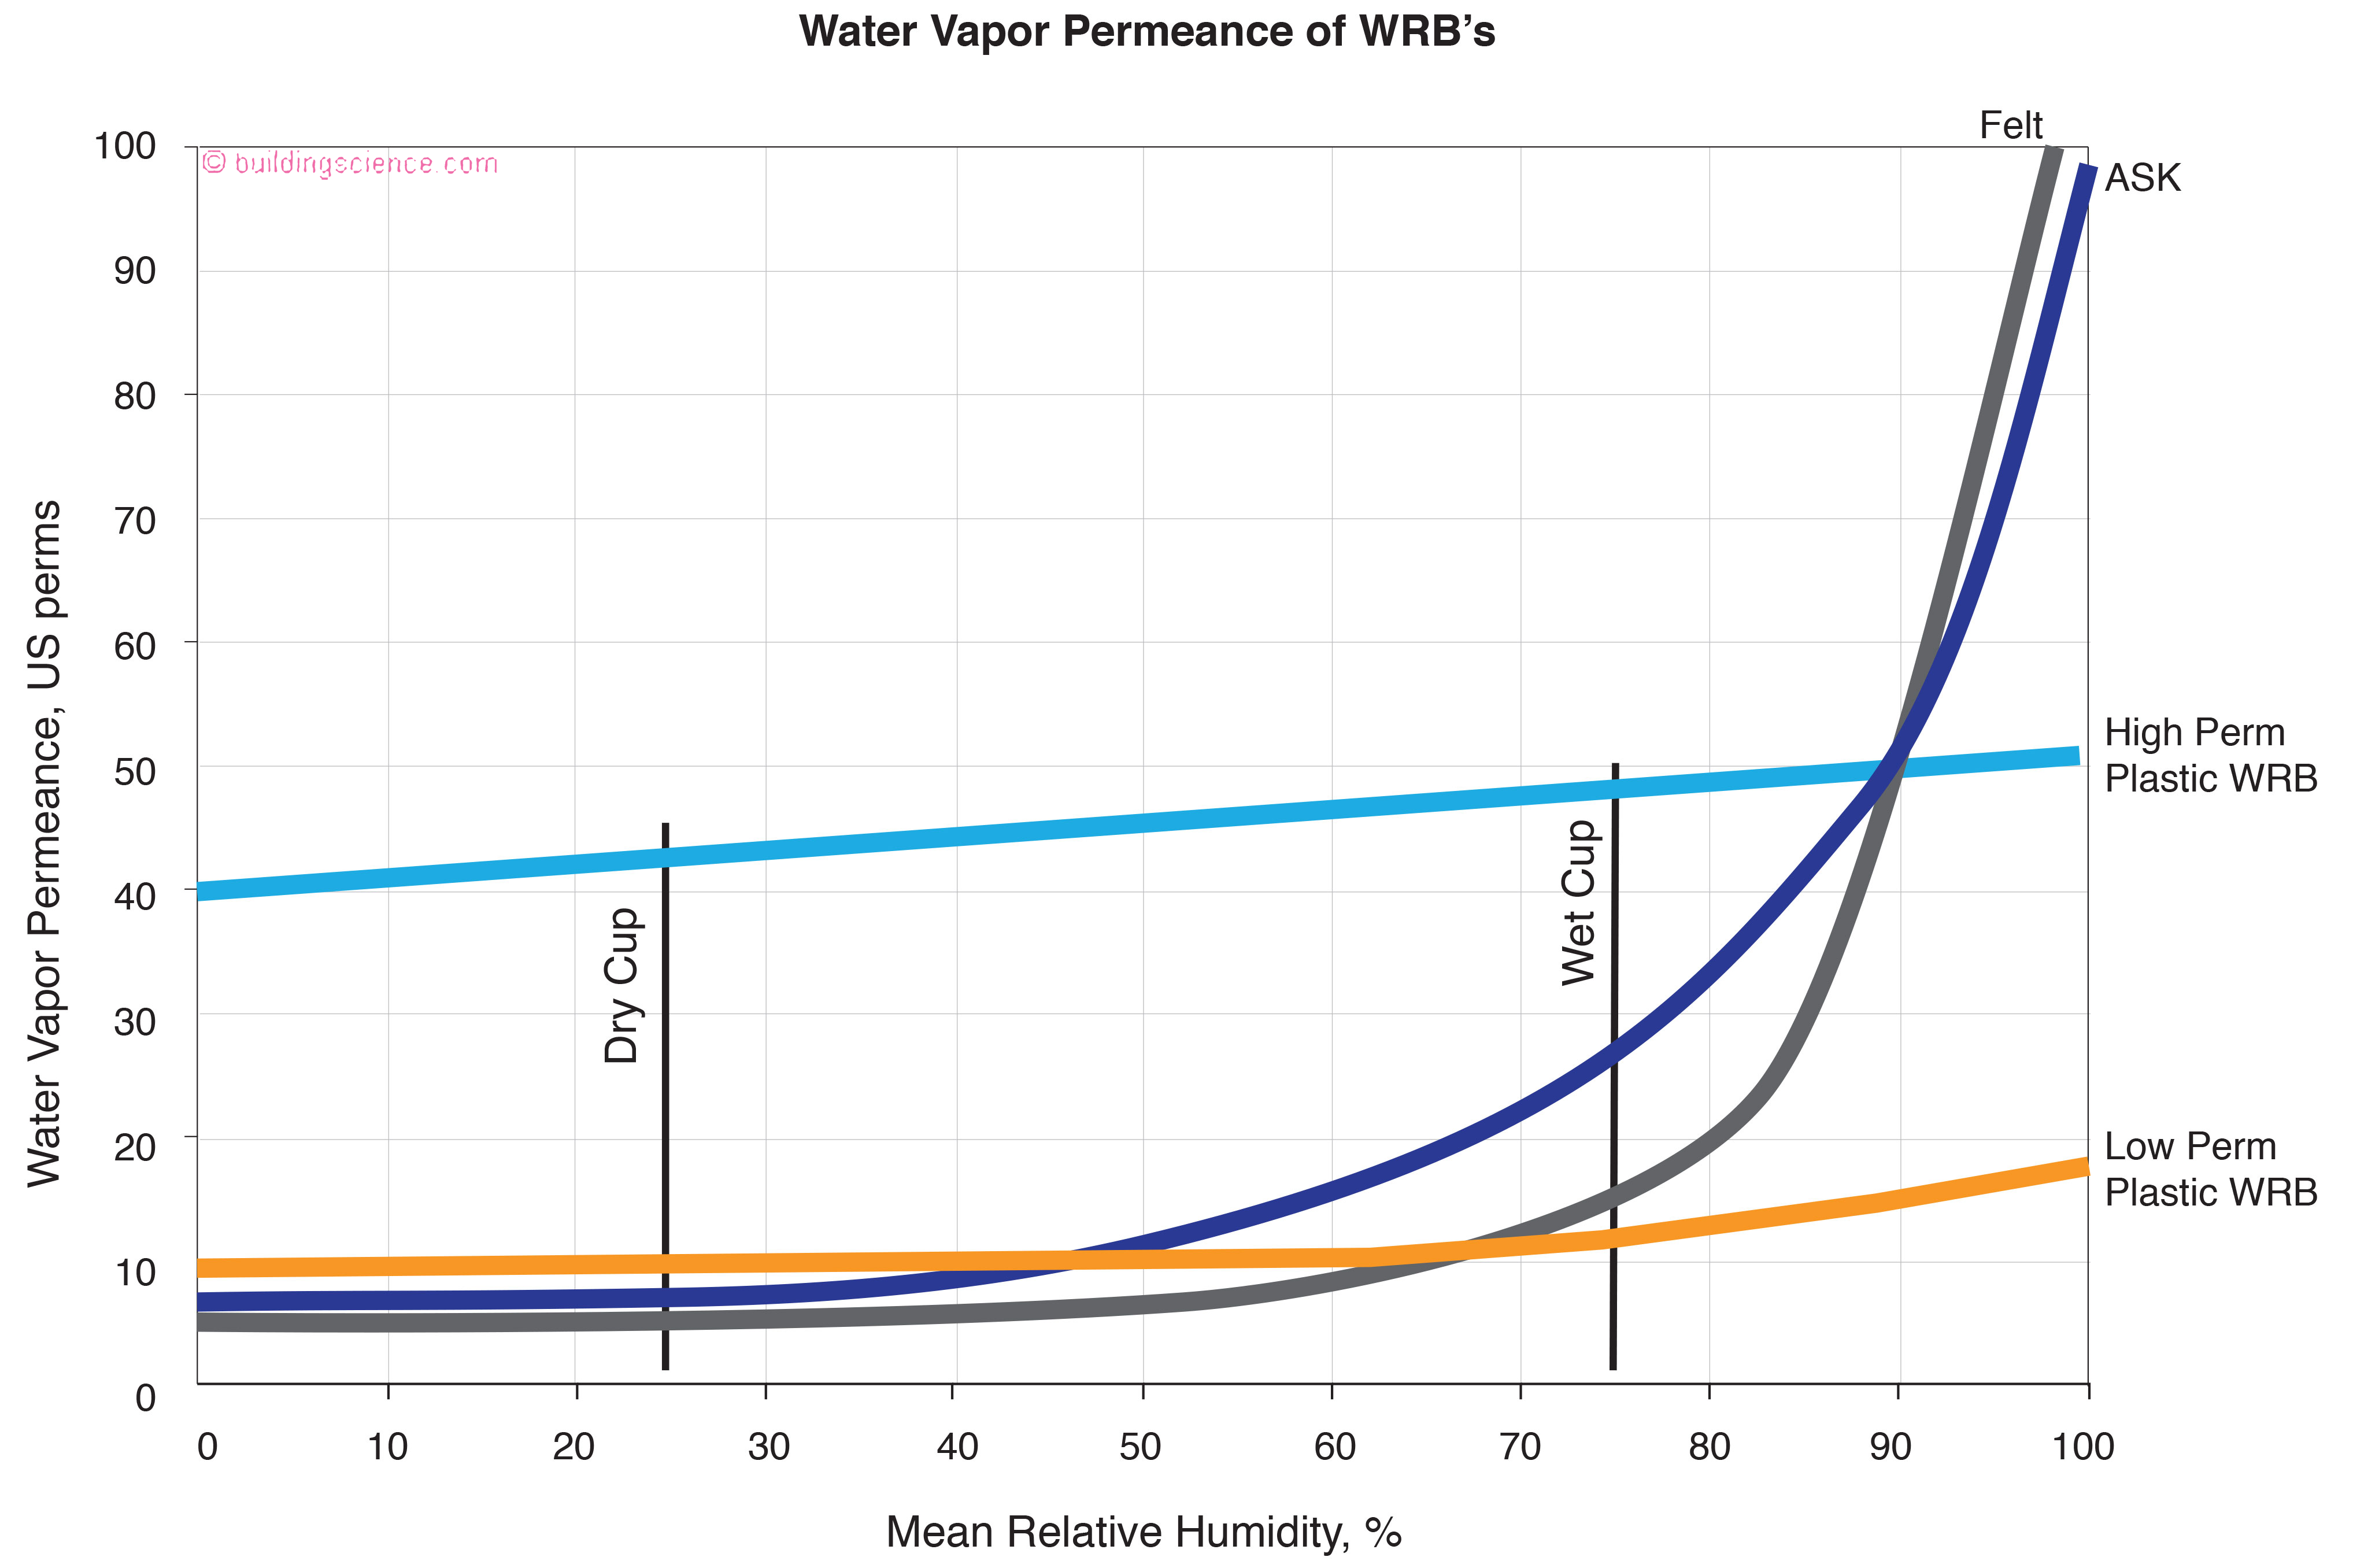
Figure 11: Permeance of Exterior Wall Layers - Look at the shape of the curves for the traditional materials: impregnated felt and asphalt saturated kraft (ASK). Notice how the bend upward past 50 percent relative humidity. Hard to knock the old materials. They were pretty darn “smart”.
On to Figure 12 – the vapor transmission of plywood and oriented strand board (OSB). What makes them work is the wet cup performance not the dry cup performance. Lots of walls would be rotting if they stayed at their dry cup value regardless of the relative humidity and their respective moisture contents.
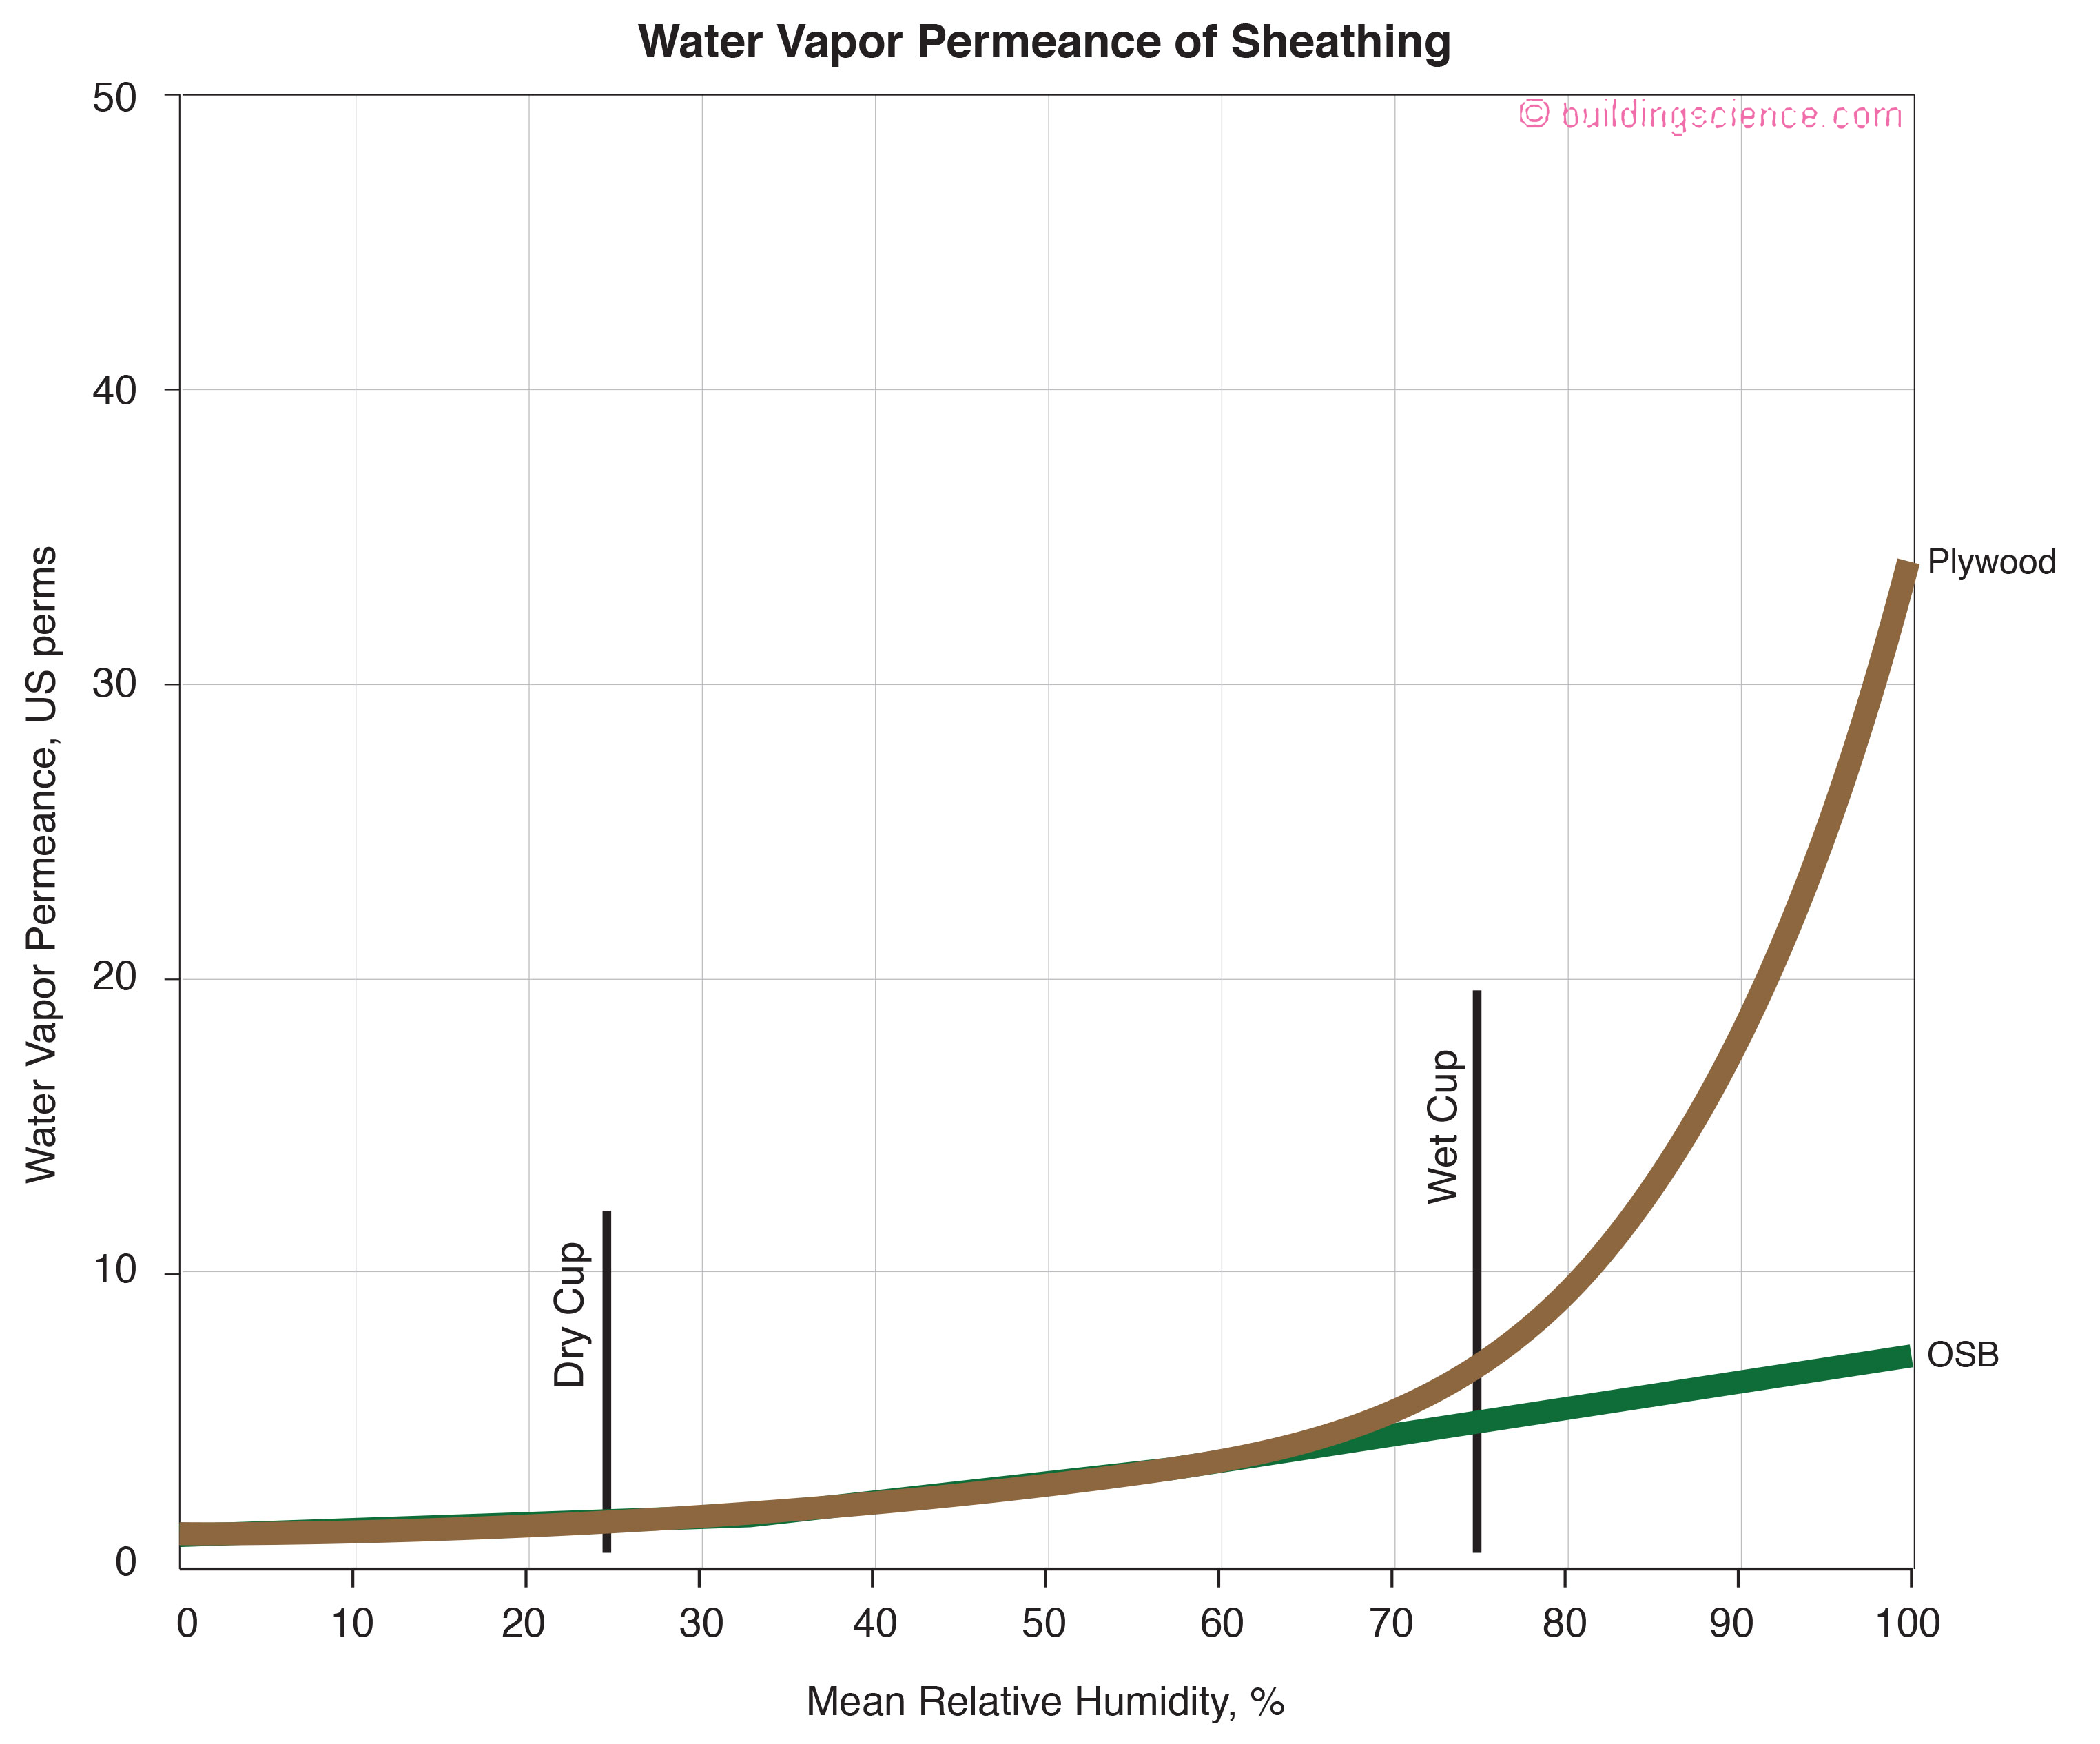
Figure 12: Vapor Transmission of Plywood and Oriented Strand Board (OSB) - What makes them work is the wet cup performance not the dry cup performance. Lots of walls would be rotting if they stayed at their dry cup value regardless of the relative humidity and their respective moisture contents.
When we start looking at composite materials and assemblies such as OSB covered with fluid applied water resistive barriers (WRB’s) (Photograph 3) or gypsum board or OSB with integral water resistive barriers (Photograph 4) all three characteristics need to be considered: dry cup, wet cup and inverted wet cup. The shape of the curve matters. Where the inflection point occurs matters. The direction of vapor and water flow matters.
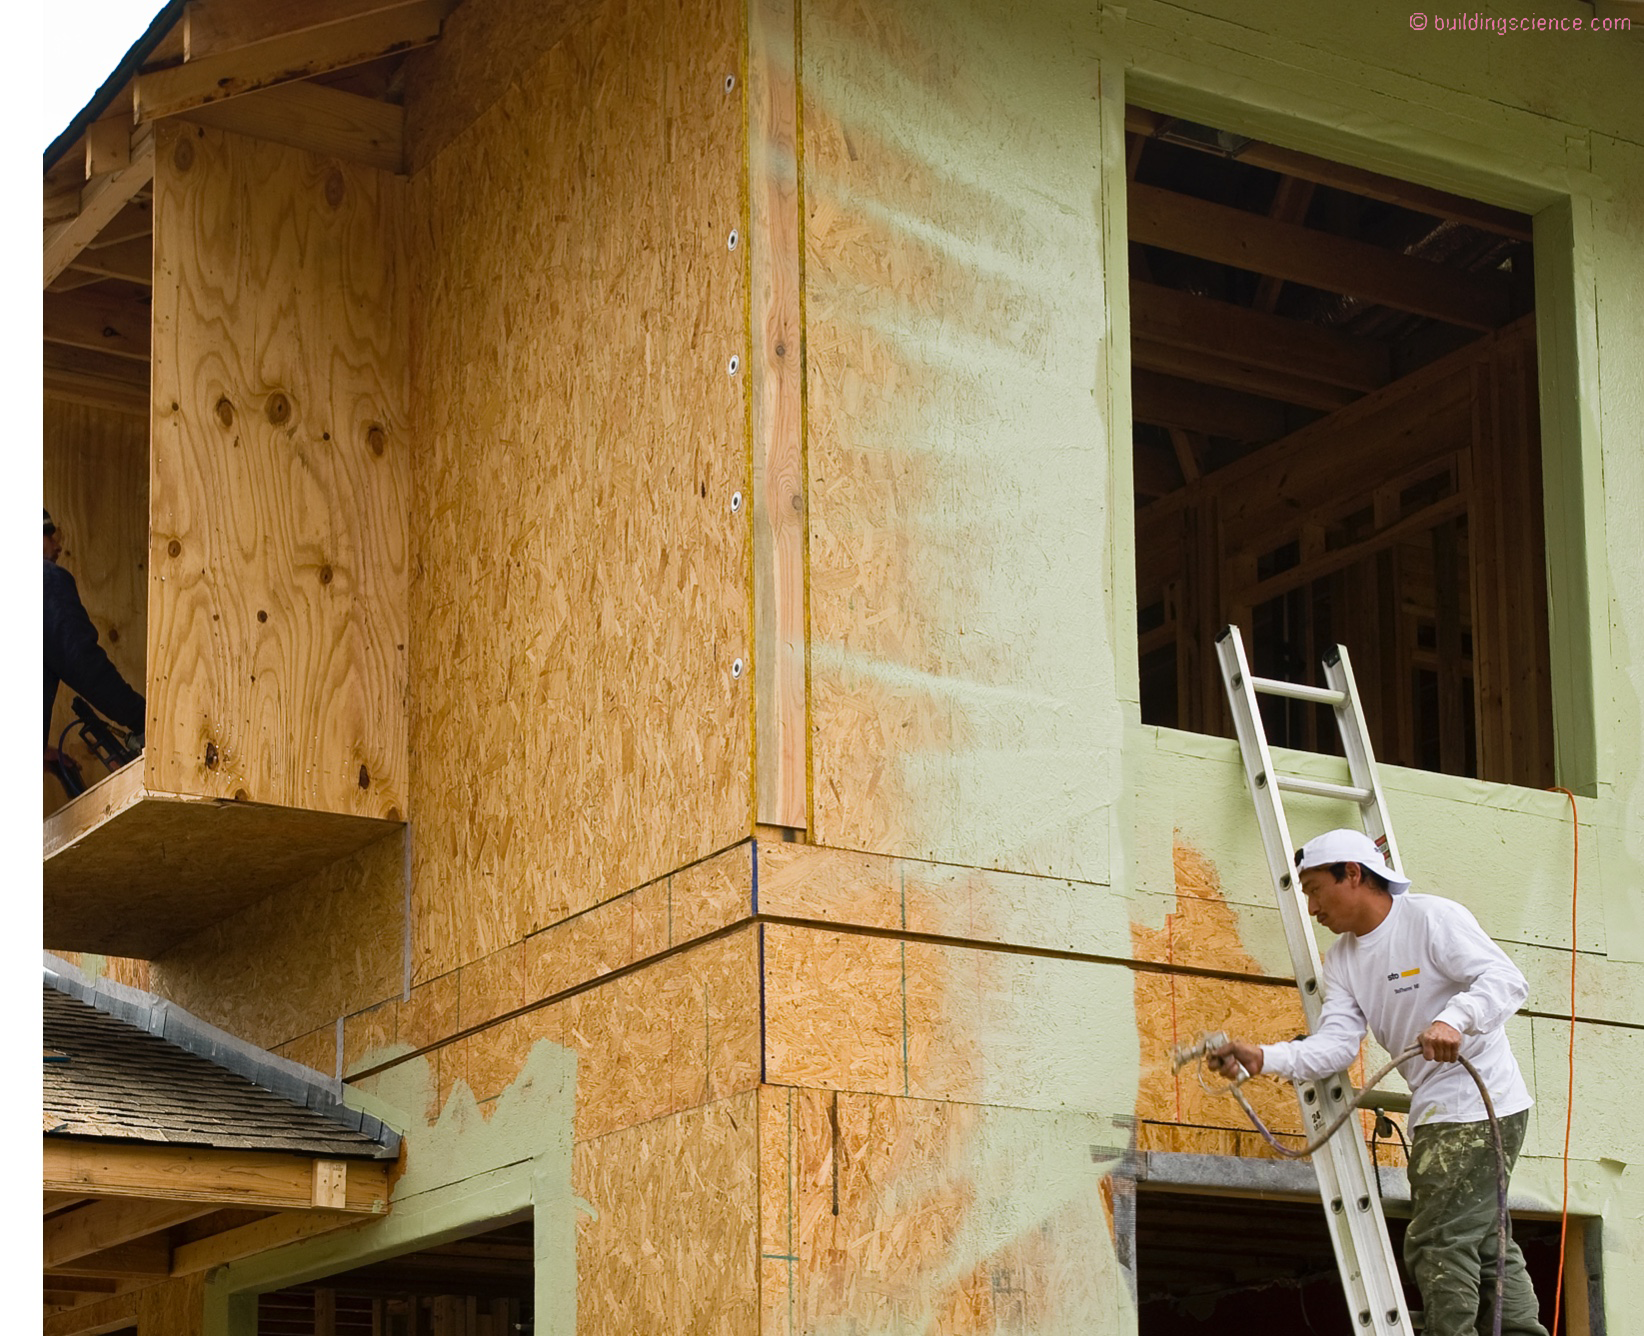
Photograph 3: Fluid Applied Membranes - Composite materials and assembly performance such as OSB covered with fluid applied water resistive barriers (WRB’s) can be understood by looking at the full sorption curve. It can be argued that the wet cup properties are more significant to performance than the dry cup properties.
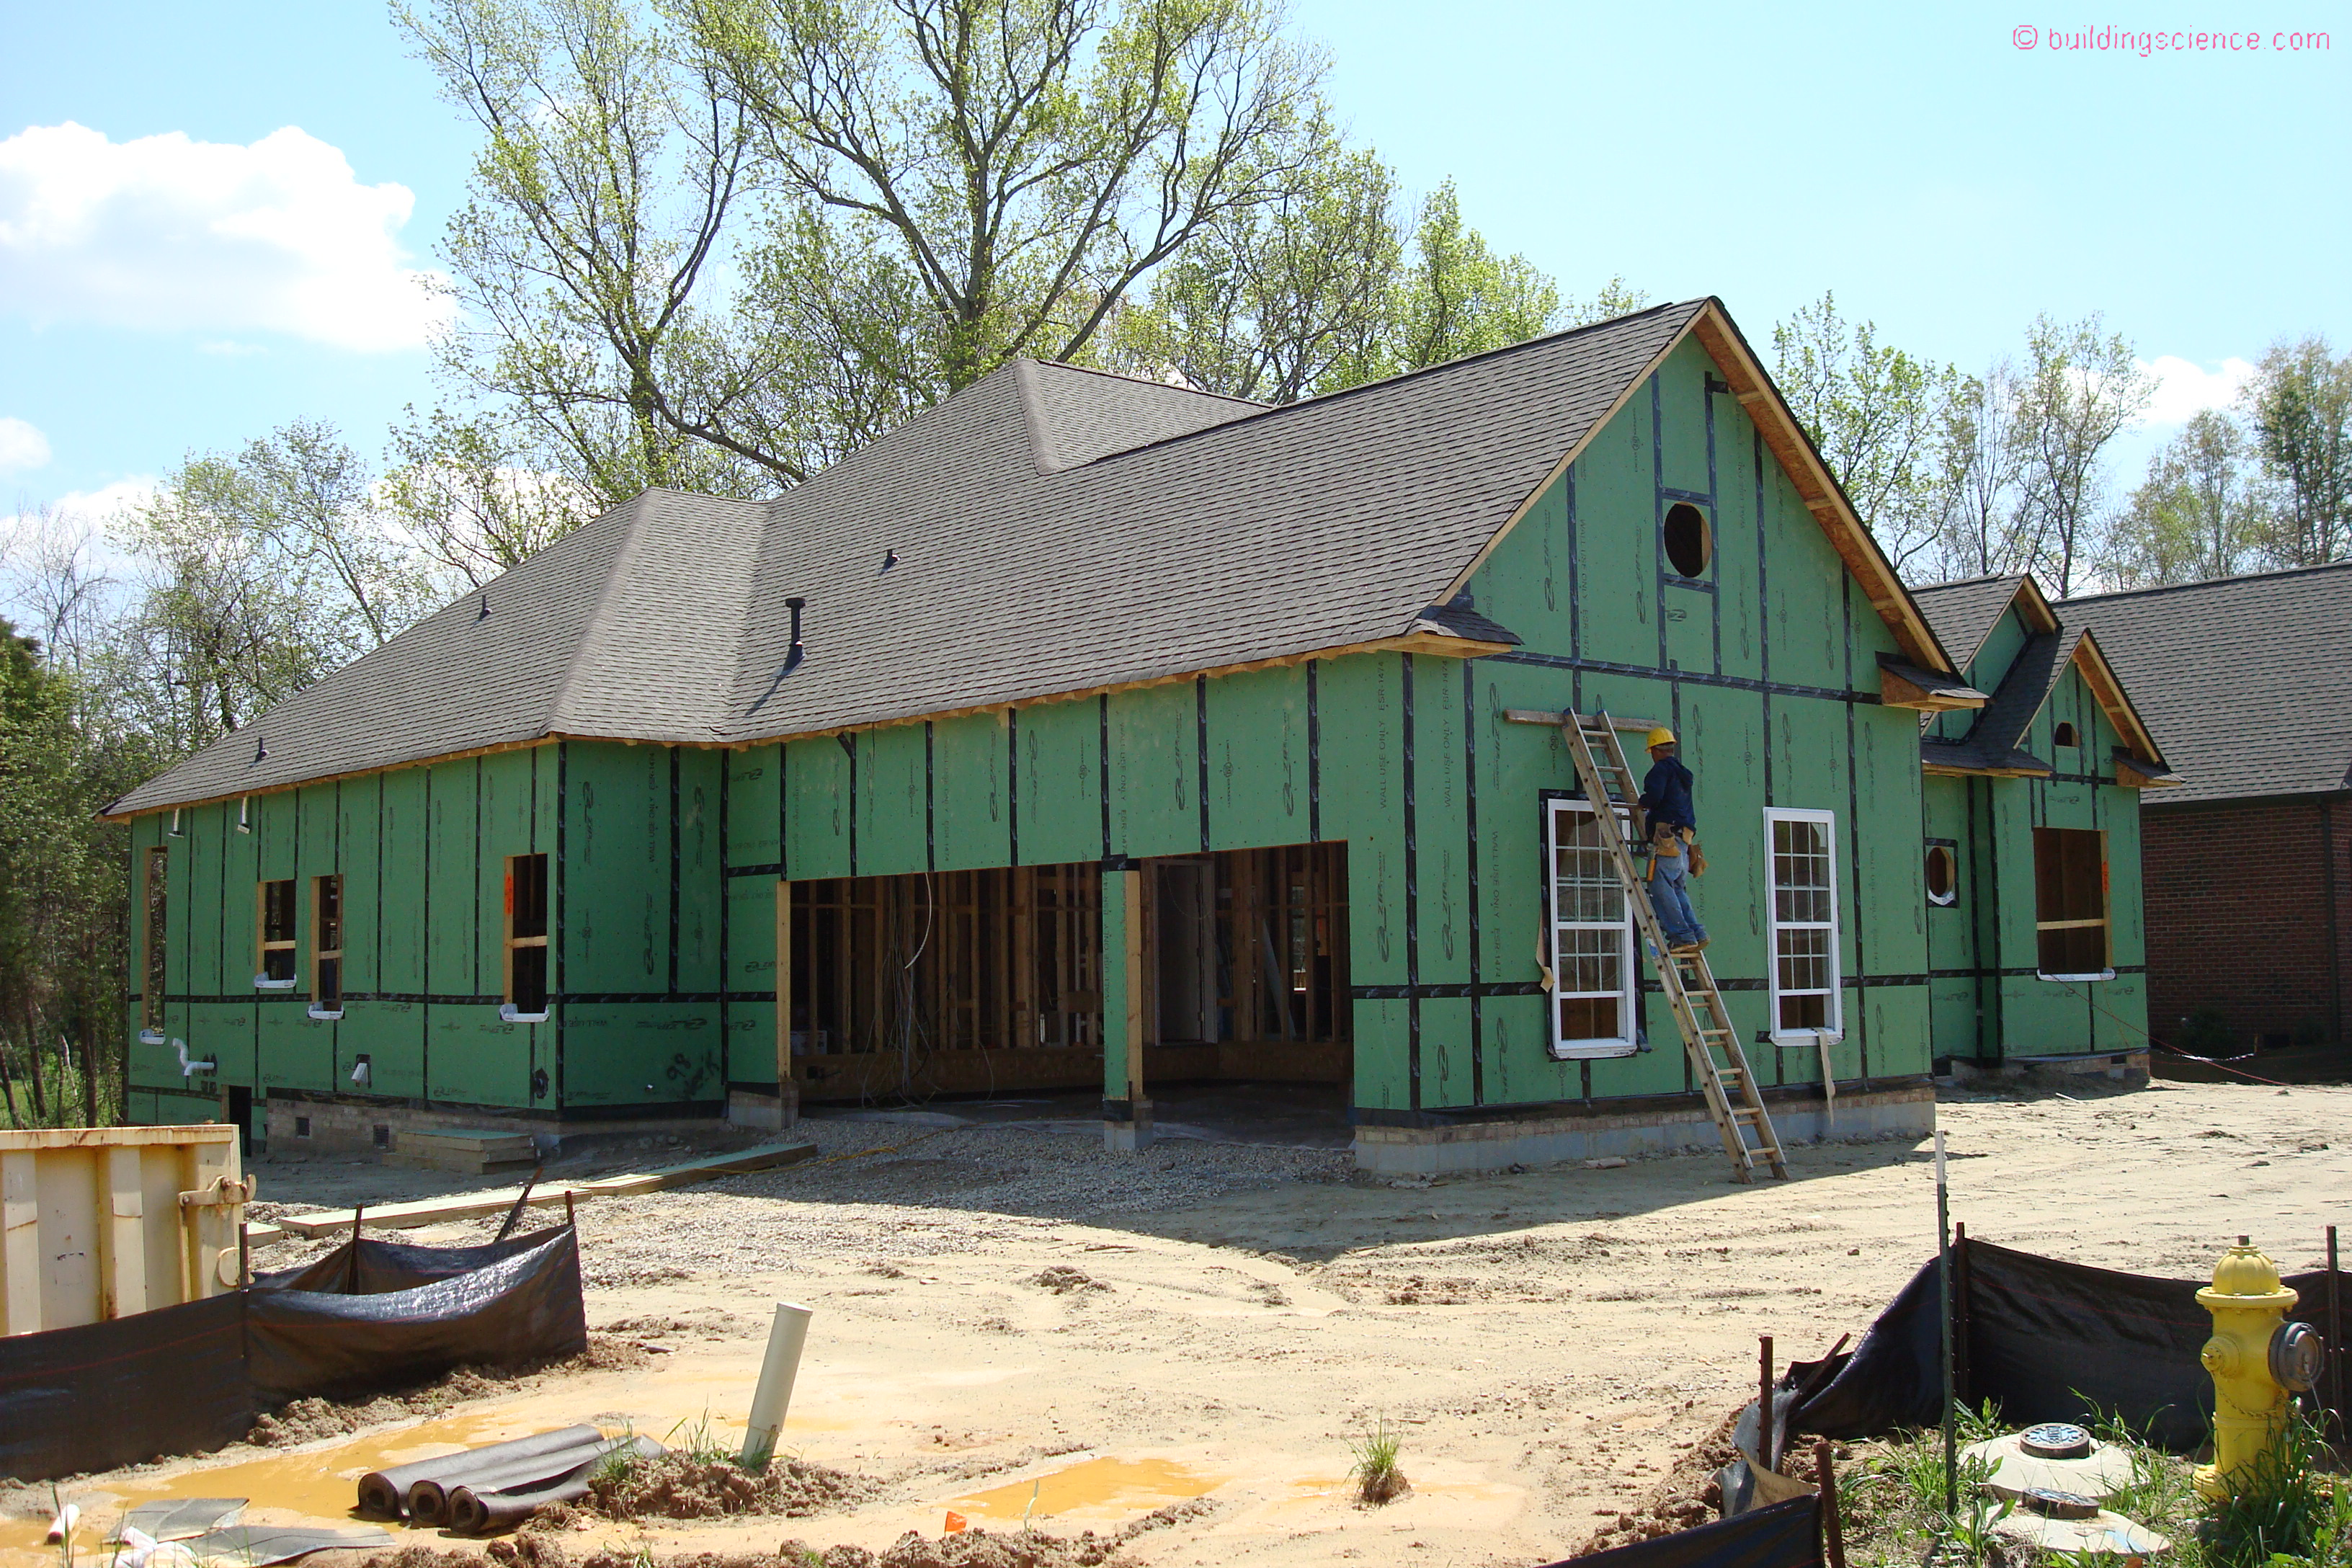
Photograph 4: Integral Water Resistive Barriers - It can be argued that the wet cup properties are more significant to performance than the dry cup properties with respect to exterior wall layers.
Joy and Wilson were ahead of their time. Materials and assemblies have finally caught up. Relative humidity matters to materials more than most of us appreciated. Magic and mysterious stuff.
References:
Joy, F. A., and Wilson, A. G. Standardization of the dish method for measuring water vapor transmission. Vol 4. Proceedings, International Symposium on Humidity and Moisture. Washington, 1963. Chapter 31, pp. 259-70 (NRCC 8838)
Kumaran, M. K. Fundamentals of transport and storage of moisture in building materials and components. Moisture Control in Buildings, ASTM: MNL18 – 2nd, Chapter 1, West Conshohocken, PA, 2009
Rounsley, R. R. Multimolecular adsorption equation. Journal of the American Chemical Society, Volume 7, No 2, pp. 308-311, 1961.
Straube, J. F., and Burnett, E. F. P. Building Science for Building Enclosures. Building Science Press Inc., Westford, MA. 2005 (ISBN: 0-9755127-4-9)
[1] These words come from Kumar Kumaran, a legend from the National Research Council of Canada.
[2] Not strictly true anymore….with modern tech toys some folks have found clusters up to 20 monolayers thick. And note that surfaces are never “flat” as drawn in Figures 4, 5 and 6.
[3] Hungarian physicist….real big dog in physics…his doctoral advisor was Werner Heisenberg. Wow. Heisenberg the uncertainty principle guy. Awarded the Nobel Prize for “the creation of quantum mechanics”. Teller the student should have also got one for the BET theory.
[4] ASTM E96 -16 Standard Test Methods for Water Vapor Transmission of Materials. Test Method A is the “desiccant” or “dry cup” approach. Test Method B is the “water” or “wet cup” approach. Test Method C is the “inverted water” or “inverted wet cup” approach.
[5] Where the curve bends upwards….