This paper describes a fully instrumented large-scale mock-up completed in a southern Ontario private school to allow direct comparisons between insulated and non-insulated walls with a focus on the evaluation of freeze-thaw and corrosion risks. Climate conditions and wall temperature, relative humidity and moisture content are compared and discussed. Climate conditions (wetting and temperature) over the monitoring period were less severe than average. As a result, measured values were used to refine computer models to simulate wall performance under more severe climate conditions.
1. Introduction
The objective of this study was to evaluate the risks associated with insulating exterior masonry walls from the interior. The building reviewed is a three-storey school constructed in Toronto in the late 1950's. The exterior walls are load-bearing masonry measuring three wythes thick. The wall interior is finished with hollow clay tile and painted plaster.
A literature review on insulating masonry walls revealed case studies demonstrating adequate performance, recommended practices to minimize risks, and preferred insulating methods. Specifically, two case studies of insulated masonry walls in a cold climate were reviewed; Dumont (2001), show walls performing as designed up to 14 years after retrofitted. General practices to minimize risks as outlined by Goncalves (2003) are: minimize exterior rain penetration into the wall, minimize penetration of interior humidity into the wall (from vapour diffusion and/or air flow), limit the thickness of the insulation, and minimize air pressure difference across the wall. Some risks associated with fiberglass batt insulation have also been highlighted by Straube (2007); in particular, convective loops promote condensation where the insulation is not applied tight against the masonry wall.
There are numerous methods to insulate masonry walls from the interior, each with specific risks and benefits in particular situations. Common materials used to insulate masonry from the interior are:
- fibreglass insulation (with independent air flow and/or vapour control layer(s));
- open-cell spray-foam insulation; and
- closed-cell spray-foam insulation.
Mechanical system interventions can also be employed to supply warm/dry air to wall cavities inboard or outboard of the retrofit insulation to promote wall drying and reduce deterioration risks.
Our study is focused on the use of interior closed-cell spray foam insulation at a building in Toronto without supplying conditioned air to any of the wall cavities.
For this specific case study, several deterioration risks were identified in a feasibility study and examined through computer modelling, including: freeze-thaw deterioration, embedded steel corrosion, organic growth, plaster deterioration and differential thermal expansion. These risks were further evaluated through field measurements of insulated and un-insulated mock-up walls, and simulated further under more severe climate conditions. This paper focuses on the more significant risks raised in the field study:
- Freeze-Thaw Deterioration: Applying insulation to the building interior can increase the risk of freeze-thaw deterioration in the exterior brick and mortar since the drying potential is reduced and materials outboard of the insulation are colder during winter conditions.
- Embedded Metal Component Corrosion: Insulating the masonry from the interior can increase the embedded metal corrosion risk, since relative humidity increases as temperatures and drying potential decreases. However, lower temperatures may also reduce corrosion risk, since corrosion rates slow down as temperatures decrease.
2.1 Methodology
Work completed for this evaluation included:
- Mock-up Wall Monitoring: Four exterior wall areas were instrumented in one room. Hourly measurements were taken on existing (un-insulated) and upgraded (insulated) wall assemblies on the East and South elevations. Details of this installation are outlined in Section 2.2 below.
- Brick Testing: Nine brick samples were removed from the exterior wall and tested to determine their water absorption properties (A-value, Straube 2005). These bricks were also used to calibrate the moisture content sensors (wood wafers) with the corresponding brick moisture content.
- Climate Analysis: The exterior climate during the monitoring period was evaluated by comparing local temperature and rain data to climatic normals (tipping rain buckets were also set-up to directly measure driving rain at the mock-up locations).
- Computer Model Extrapolations: Our previous computer models were refined using measured brick properties and verified against measured data. Models were then completed with more severe climatic conditions than those measured (due to less than normal wetting conditions during the initial monitoring period), to further evaluate wall performance. This work was completed using a computer based analytical program (WUFI® Pro 4.1, Fraunhofer Institute for Building Physics 2006).
2.2 Mock-Up Wall Monitoring Set-Up
Four mock-up walls were constructed. A room was selected on the top floor and at an outside corner facing South and East since this was expected to be the most severe climate exposure for this building. Figure 1 contains the wall sections and sensor locations. Photo No.1 shows the mock-up wall locations from the exterior. A description of the tested wall assemblies is as follows:
- Zone A: Existing (Un-insulated) Wall Assembly, East Elevation: Three wythes brick; 50mm hollow clay tile; 20mm plaster; 2 coats paint (likely oil);
- Zone B: Modified (Insulated) Wall Assembly, East Elevation: Three wythes brick; 50mm SPF insulation; 25mm air space; 12mm drywall; 1 coat primer; 2 coats latex paint;
- Zone C: Modified (Insulated) Wall Assembly, South Elevation: Three wythes brick; 50mm SPF insulation; 25mm air space; 12mm drywall; 1 coat primer; 2 coats latex paint;
- Zone D: Existing (Un-insulated) Wall Assembly, South Elevation: Three wythes brick; 50mm hollow clay tile; 20mm plaster; 2 coats paint (likely oil).
Nine sensors were installed in each wall to measure temperature, relative humidity and moisture content at various locations across the wall (see Figure 1). Exterior temperature and relative humidity were measured directly outside the test walls. Driving rain was measured on the exterior of the walls, at the bottom of Zones B and C (South and East). Interior temperature and relative humidity were also measured at two locations within the test room.
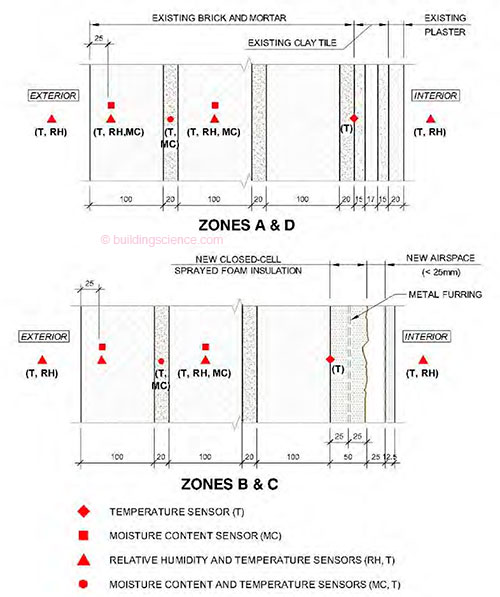
Figure 1: Mock-Up Wall Sections—Zones A&D: existing un-insulated wall assembly, zones B&C: modified insulated wall.
The temperature sensors are 10KOhm NTC thermistors, and the relative humidity sensors are capacitance based sensing elements housed in vapour permeable covers to protect them from liquid water. The moisture content in the brick and mortar was measured using surrogate wood resistance sensors. These sensors are a plug of eastern white pine with the resistance measured across the material by a pin on one end and a ring around the other. These sensors are similar to those examined by Carll & TenWolde (1996) and Ueno & Straube (2008).
All wall sensors were installed from the interior, through 13mm diameter holes drilled to the depth of interest. The temperature and relative humidity sensors had a prefabricated plastic plug matching the diameter of the hole attached to the back of the sensor. Once in place, the back of the plugs were sealed in place with epoxy. The balance of the drilled hole was then filled with spray foam insulation. The moisture content sensors were also installed through drilled holes, but were encapsulated with bentonite clay to provide full contact between each sensor and the parent material. The balance of these holes was also filled with spray foam insulation. The wood resistance sensors were tested in a lab to calibrate the wood moisture content readings with the moisture content of the parent brick and mortar. Further details about similar sensors used are described in Straube et.al. (2002).
The driving rain gauge uses a standard tipping bucket to measure water volume, mounted in a custom housing. The housing mounts flush to the wall, covering an area about 300mm x 300mm, and is delineated at its perimeter by 75mm long returns, perpendicular to the wall.
The monitoring system was commissioned on September 18, 2007. This paper reviews data collected over the first winter, from September 19, 2007 to June 1, 2008.
3. Key Findings
Our key findings from the work performed are as follows:
3.1 Below-Average Climate Conditions During Monitoring Period
The climatic conditions at the site over the monitored period were less severe than average for Toronto. The key climatic variables for this evaluation are rain wetting and exterior temperatures as they dictate the number of expected freeze-thaw cycles and conditions for embedded metal corrosion.
Below-Average Wall Wetting: Expected driving rain at the site was calculated using publicly available vertical rainfall, wind direction and wind speed data from nearby Queens Park (calculated per procedures described in Straube and Burnett (2005)). A rain deposition factor of 0.5 was used, as determined by comparing calculated wind driven rain from the data noted above against measured wind driven rain on site. Based on this evaluation, the monitored walls were only exposed to about half the driving rain that occurs in an average year, as shown in Figure 2. While there was less-than-average driving rain on the South and East elevations over the period under review, there was significant vertical rainfall over this period. Unfortunately, most of this rain was driven onto the N, W and SW elevations. In fact, these elevations experienced 2.5 times the average rainfall. In short, this was an uncharacteristic year for driving rain, with less driving rain from typical directions and more from atypical directions. As the conditions on the monitored walls provide below-average conditions for evaluating freeze-thaw or corrosion risks, the monitoring results were used in combination with computer modelling to further evaluate deterioration risks.
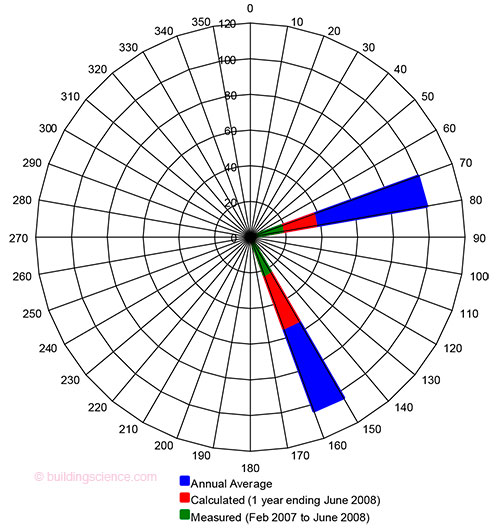
Figure 2: Wind-Driven Rainfall on Test Walls—Wind driven rain shown is for various periods using Toronto Pearson airport and Queen’s Park weather stations. A rain deposition factor of 0.5 is used, as determined by on site wind-driven rain measurement.
Below-Average Number of Zero Degree-Crossings: The monitored walls were exposed to 70% of the zero degree-crossings that would result during the 3rd coldest year in 30 (10th percentile) from the computer model database. The number of zero-crossings is comparable to the amount seen in the 3rd warmest year in 30 (10th percentile) from the computer model database. As these are also below-average conditions for evaluating freeze-thaw risks, the monitoring results were used in combination with computer modelling to further evaluate deterioration risks. . .
Download complete document here.